


Offizieller Lieferant
Als offizieller und autorisierter Distributor beliefern wir Sie mit legitimen Lizenzen direkt von mehr als 200 Softwareherstellern.
Sehen Sie alle unsere Marken.
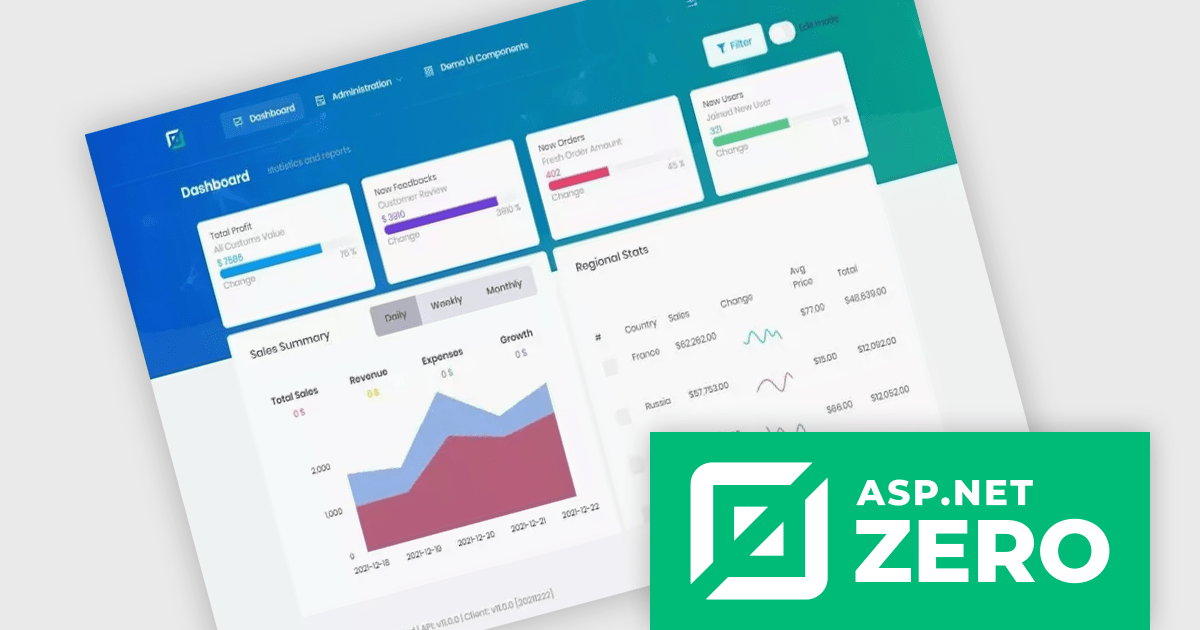
ComponentSource, a leading provider of software development tools, has partnered with ASP.NET Zero (by Volosoft), a software solution provider that creates reusable software libraries/frameworks/tools, distributed architectures/systems, multi-threaded, and real-time applications. The ASP.NET Zero team has extensive experience with Microsoft technologies, JavaScript frameworks, development and design tools, database management systems and mobile development platforms.
ASP.NET Zero is a robust web application development framework specifically designed to expedite the creation of modern, high-performing web applications. It functions as a pre-configured foundation, akin to a pre-built structure with essential utilities already in place. This enables developers to concentrate their efforts on crafting the unique functionalities that differentiate their application.
ASP.NET Zero is licensed based on the number of developers using the framework and the number of products being developed. See our ASP.NET Zero licensing page for full details.
For more information, visit our ASP.NET Zero publisher page.
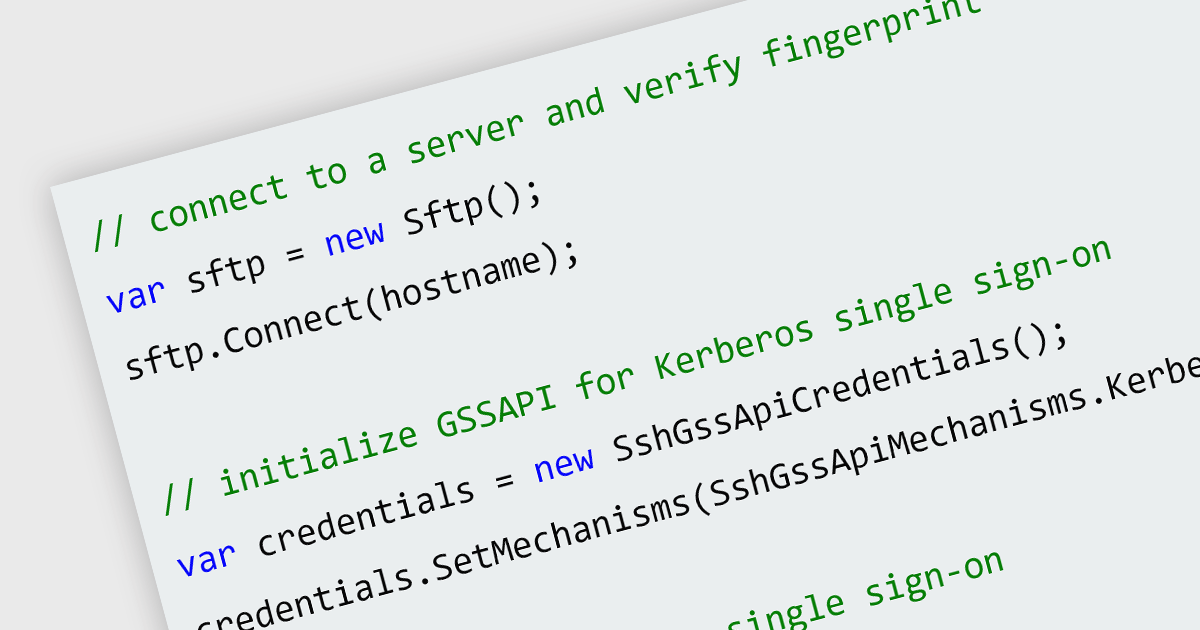
Server-side authentication is a security mechanism that verifies the identity of a user or device requesting access to a server or application. It typically involves the exchange of credentials, such as usernames and passwords, between the client and server, followed by validation of these credentials against a centralized database or directory. This ensures that only authorized individuals or systems can access restricted resources and prevents unauthorized access.
Several .NET 8 communications and messaging components offer support for server-side authentication including:
For an in-depth analysis of features and price, visit our .NET 8 communications and messaging components comparison.
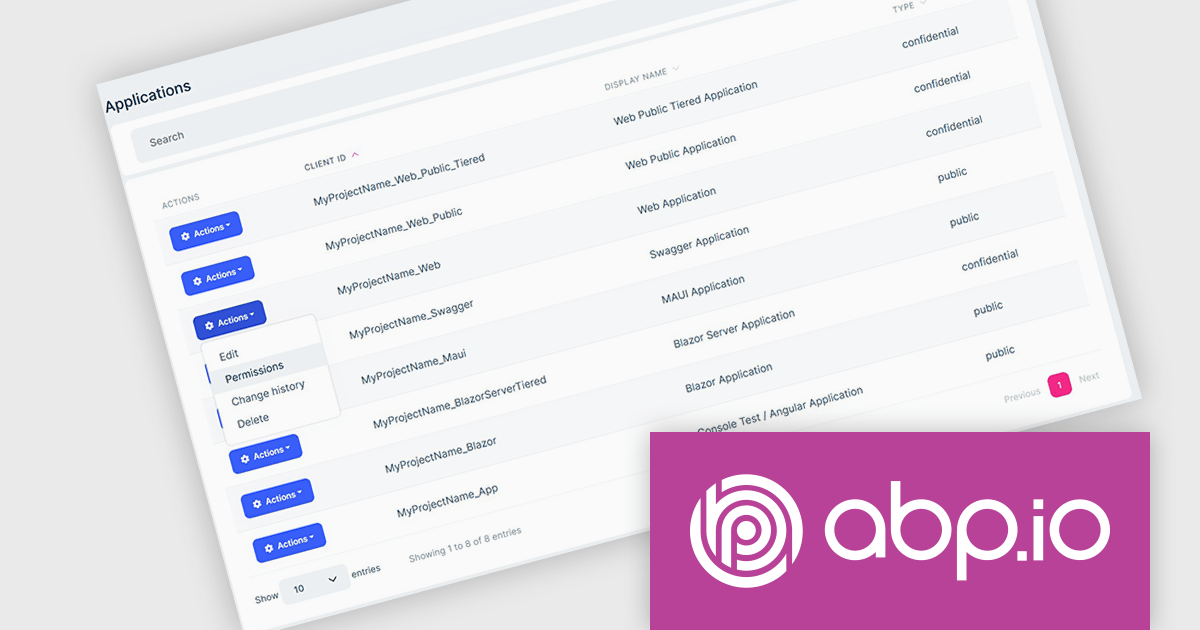
ComponentSource, a leading provider of software development tools, has announced a new partnership with ABP (by Volosoft), a software solution provider that develops reusable software libraries/frameworks/tools, distributed architectures/systems, multi-threaded and real-time applications. Specializing in tools and frameworks built on the .NET ecosystem, Volosoft provides businesses with innovative products that streamline development processes. ABP is known for its professional support services, and strong developer community, making it a trusted partner for organizations worldwide.
The ABP Platform offers an opinionated architecture designed to accelerate the creation of enterprise-level solutions. It provides a modular and layered architecture built on top of ASP.NET Core, allowing developers to create scalable, maintainable, and high-performance applications. ABP Platform offers extensive pre-built modules such as identity management, multi-tenancy, and permission systems, reducing development time and effort. Its flexibility supports microservices, monolithic architectures, and cloud deployments. ABP is ideal for organizations looking to build modern applications with features like user management, auditing, localization, and more, making it a strong choice for SaaS products, internal business tools, or complex distributed systems.
The ABP Platform is available as a Team, Business or Enterprise license, which entitles developers to use the platform's Pro features and provides software updates and technical support for 1 year. See our ABP Platform licensing page for full details.
For more information, visit our ABP publisher page.
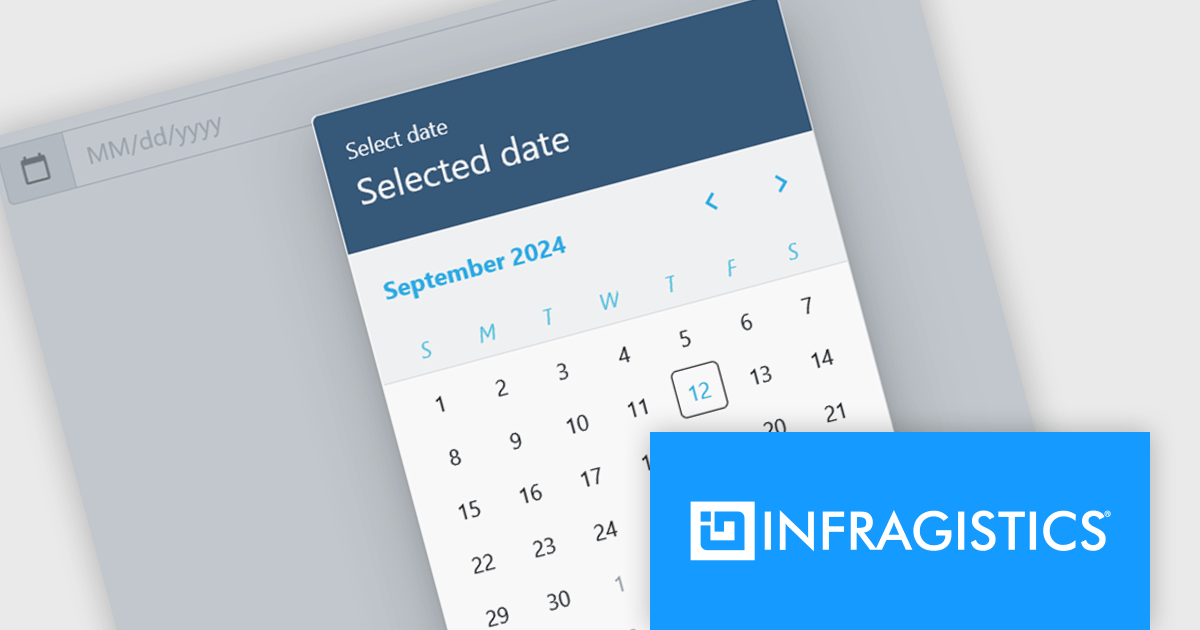
Infragistics Ignite UI for Blazor is a comprehensive UI component library designed specifically for .NET developers building modern web applications with Blazor. It offers a rich set of over 60 components, including performant data grids, interactive charts, and essential UI elements. This allows developers to craft visually appealing, feature-packed Blazor applications with a focus on data visualization, user interaction, and a variety of design themes.
The Ignite UI for Blazor 24.1.46 release adds a new date picker component. Designed to streamline date input processes, it offers a user-friendly interface that allows users to either manually type in a date or select a specific date from a convenient calendar popup. The component's lightweight design and straightforward implementation make it easy to integrate into Blazor applications. The date picker provides multiple view options, including month, year, and decade, enabling users to navigate effortlessly to their desired date. Additionally, it supports essential validation features like minimum and maximum date constraints and required field checks, ensuring data integrity and accuracy.
To see a full list of what's new in version 24.1.46, see our release notes.
Infragistics Ignite UI for Blazor is available as part of Infragistics Ignite UI which is licensed per developer and is offered as a Perpetual License with a 1, 2 or 3 year support and maintenance subscription. See our Infragistics Ignite UI licensing page for full details.
Infragistics Ignite UI for Blazor is available in the following products:
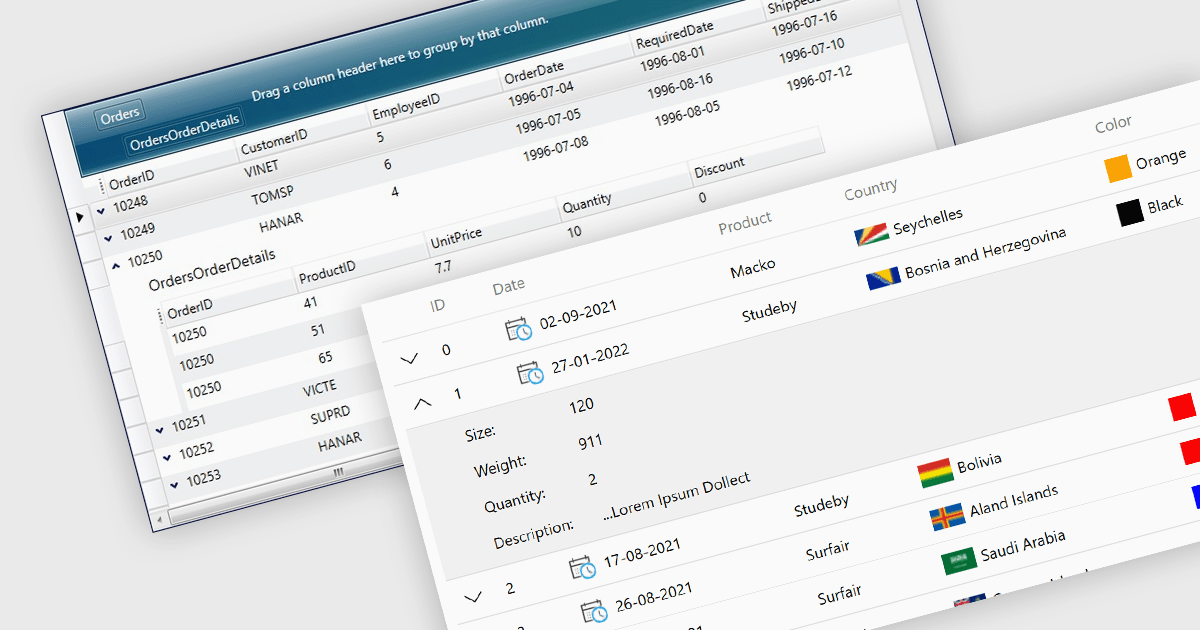
Master-detail is a user interface design technique where a primary data set (the master) is displayed in a grid format, and related information (the detail) is typically shown in an adjacent pane when a master item is selected. The resulting hierarchical structure allows users to efficiently navigate and explore complex data sets by viewing high-level information in the master grid while accessing more granular details on demand, without navigating away from the main page. The master-detail view enhances the user experience as it improves the organization of the grid and streamlines workflows as users can quickly switch between records and details.
Several .NET 8 WPF grid components offer support for master-detail, including:
For an in-depth analysis of features and price, visit our comparison of .NET 8 WPF grid components.


Tel.: (888) 850 9911
Fax: +1 770 250 6199


