


Offizieller Lieferant
Als offizieller und autorisierter Distributor beliefern wir Sie mit legitimen Lizenzen direkt von mehr als 200 Softwareherstellern.
Sehen Sie alle unsere Marken.

Bullet charts are efficient data visualization tools designed to display performance metrics against a target within a single, streamlined bar. Ideal for compact spaces on dashboards, bullet charts convey a KPI's current status, target, and performance range in a minimalist view, making them perfect for summarizing key data points without overwhelming the interface. They are highly customizable, supporting varied colors, labels, and thresholds, and their component-based structure in React allows developers to implement real-time updates, enabling users to monitor changing data continuously. These charts promote a responsive, interactive experience, providing powerful options for building detailed, data-rich applications.
Several React chart controls offer bullet chart support including:
For an in-depth analysis of features and price, visit our React bullet chart controls comparison.

Charts in a dashboard component transform raw data into clear, actionable visuals, making it easy to monitor trends, track performance, and spot critical insights in real time. These interactive tools support various use cases, from sales forecasting and KPI tracking to project progress monitoring and customer behavior analysis. By offering a centralized, intuitive view of essential metrics, charts help teams make faster, data-driven decisions, optimize operational efficiency, and respond proactively to emerging opportunities or issues.
Several JavaScript products offer chart components with dashboard support including:
Explore our range of JavaScript dashboard components.
Need help to find the right software license, upgrade or renewal? Call, Email, or Live Chat with our experts.

Printing functionality in reporting controls allows users to generate physical or digital copies of reports directly from within the software, ensuring seamless access to formatted, ready-to-distribute documents. This capability is especially valuable in data-driven applications where users need to share insights in a standardized format, such as in financial, operational, or compliance reporting. With printing support, users can define how reports appear on paper or in PDF format, often choosing custom layouts, page sizes, or specific sections for export, all of which aid in producing polished and accessible presentations of data. By reducing the manual steps needed to prepare data for distribution, printing functionality helps streamline workflows and enhance the utility of reporting tools for both internal and external stakeholders.
Several React reporting controls offer printing support including:
For an in-depth analysis of features and price, visit our React Reporting controls comparison.

ONLYOFFICE Docs is a comprehensive online editor, allowing users to create text documents, spreadsheets, presentations, and forms. It enables your users to edit, share, and collaborate on documents online in their preferred browser, within your own application. It is fully compatible with OOXML (Office Open XML) formats and supports popular Microsoft Office and other document formats such as CSV, DOC, DOCX, EPUB, HTML, ODP, ODS, ODT, PDF, PPT, PPTX, RTF, TXT, XLS, and XLSX.
The ONLYOFFICE Docs v8.2 update adds support for performing iterative calculations. This enables formulas to be repeatedly recalculated until a specific, stable result is reached or a set number of attempts is made. By setting iteration limits and defining acceptable precision levels, iterative calculations enable users to control the number of recalculations, allowing the formula to reach an approximation or convergence point that serves as the final value. This process is particularly useful when dealing with circular references, where a formula refers to its own cell either directly or through a sequence of references involving other cells. Without iterative calculations, such formulas would produce errors, as they would require an infinite loop of recalculations. This is widely used in scenarios requiring complex dependencies, such as financial projections, engineering simulations, and scientific modeling.
To see a full list of what's new in v8.2.0, see our release notes.
ONLYOFFICE Docs is licensed by the number of simultaneous document connections and is available as an annual license with 1 year support and upgrades. See our ONLYOFFICE Docs licensing page for full details.
For more information, see our ONLYOFFICE Docs product page.
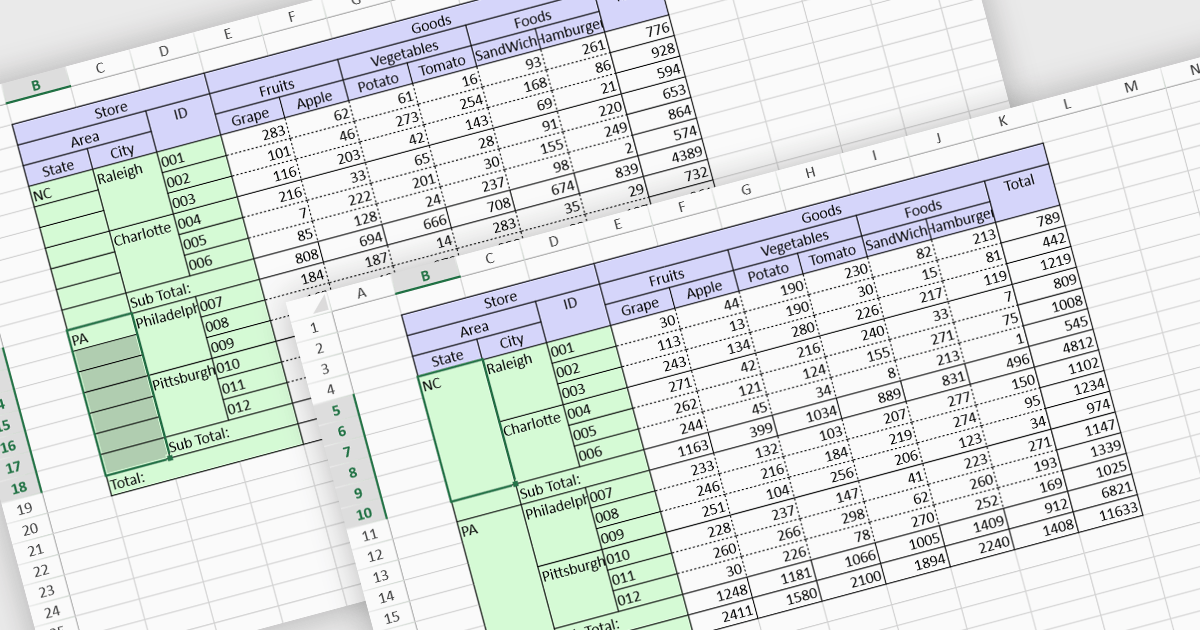
Cell merging is a spreadsheet feature that combines two or more adjacent cells into a single, larger cell, creating a unified space for data. This is particularly useful for creating visually organized and readable spreadsheets, allowing headers to span multiple columns or rows, enhancing clarity and alignment in complex data sets. By merging cells, users can create more structured layouts, making the data presentation cleaner and often easier to understand at a glance. For example, in financial reporting or project tracking sheets, merging cells can emphasize titles, group categories, or highlight specific sections of data, adding visual polish. It can also help when building dashboards, forms, and reports where visual hierarchy and structured information flow are essential for end-user readability and comprehension.
Several React spreadsheet controls offer the ability to merge cells including:
For an in-depth analysis of features and price, visit our React spreadsheet controls comparison.


Tel.: (888) 850 9911
Fax: +1 770 250 6199


