


Offizieller Lieferant
Als offizieller und autorisierter Distributor beliefern wir Sie mit legitimen Lizenzen direkt von mehr als 200 Softwareherstellern.
Sehen Sie alle unsere Marken.

ONLYOFFICE Docs is a comprehensive online editor, allowing users to create text documents, spreadsheets, presentations, and forms. It enables your users to edit, share, and collaborate on documents online in their preferred browser, within your own application. It's fully compatible with OOXML (Office Open XML) formats and supports popular Microsoft Office and other document formats such as CSV, DOC, DOCX, EPUB, HTML, ODP, ODS, ODT, PDF, PPT, PPTX, RTF, TXT, XLS, and XLSX.
The ONLYOFFICE Docs v8.1.0 update enhances the native PDF editor with text editing capability. This new feature improves the workflow for developers integrating ONLYOFFICE Docs into their applications. It allows them to directly edit text within PDF files, ensuring an improved user experience for seamless content modifications, without the need for external tools. This update provides a more integrated and streamlined approach to document editing, catering to the needs of developers seeking robust and reliable PDF editing capabilities within their software solutions.
To see a full list of what's new in v8.1.0, see our release notes.
ONLYOFFICE Docs is licensed by the number of simultaneous document connections and is available as an annual license with 1 year support and upgrades. See our ONLYOFFICE Docs licensing page for full details.
For more information, see our ONLYOFFICE Docs product page.
Stimulsoft Reports.JS provides a robust reporting toolkit designed specifically for JavaScript applications. This library leverages a client-side architecture, offering a pure JavaScript report engine for efficient report rendering directly within web browsers. The solution includes a user-friendly report designer for building reports with various data sources and visualizations, along with a report viewer for seamless integration and display within your JavaScript applications. This eliminates the need for server-side dependencies or browser plugins, simplifying the development process for embedding powerful reporting functionalities into your web projects.
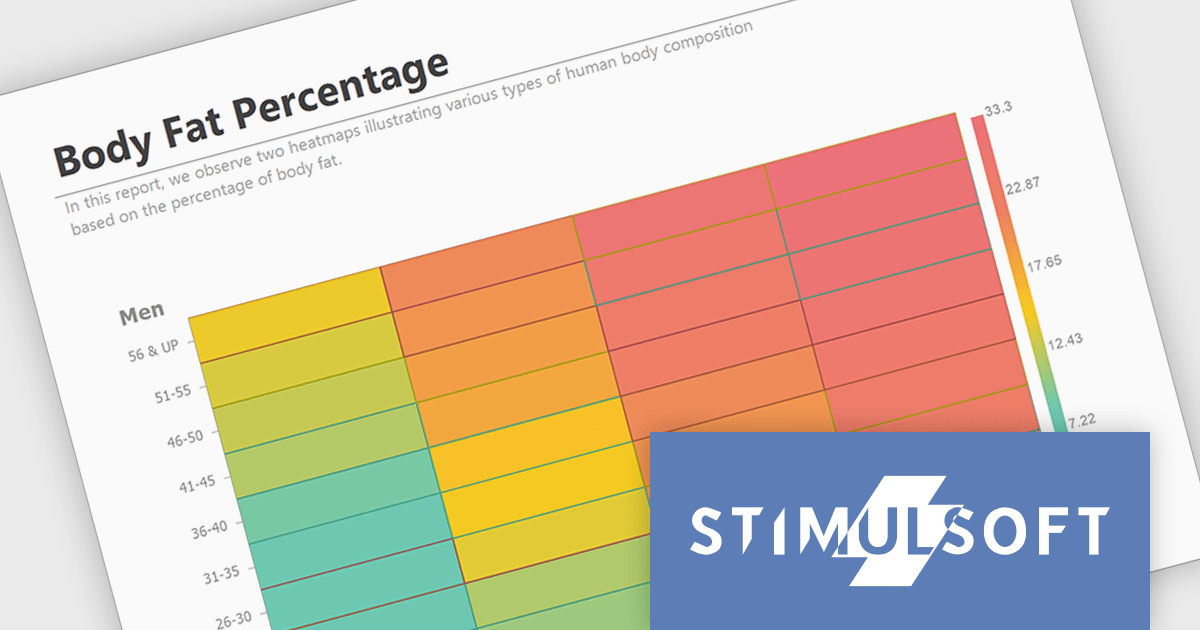
The Stimulsoft Reports.JS 2024.3 update adds a powerful new data visualization tool: the heatmap chart. This intuitive chart type excels at revealing patterns and trends within large datasets. By visually encoding data values through color gradients, heatmaps simplify complex information, allowing users to quickly identify areas of high, medium and low concentration. Stimulsoft Reports.JS seamlessly integrates heatmaps into your existing reporting workflows, enhancing data exploration and communication for your users.
To see a full list of what's new in version 2024.3, see our release notes.
Stimulsoft Reports.JS is licensed per developer and is available as a Perpetual license with 1 year support and maintenance. See our Stimulsoft Reports.JS licensing page for full details.
Stimulsoft Reports.JS is available in the following products:

Rating controls for React are user interface components designed to allow users to input and edit rating values, typically represented by stars, numeric values, or other graphical symbols. These controls are essential in applications where user feedback or rating is required, such as e-commerce sites, review platforms, and survey forms. They provide an intuitive, interactive way for users to submit ratings, ensuring that the data is captured accurately and efficiently. These controls often come with customization options to fit the application's design and can handle various events and validations to enhance the user experience and data integrity.
Several React data editor collections offer Rating controls including:
For an in-depth analysis of features and price, visit our comparison of React data editors.

DevExpress BI Dashboard (part of DevExpress Universal) empowers you to craft interactive dashboards for desktop, web and mobile applications. It provides a visual designer for building dashboards without writing code, allowing you to drag-and-drop various data visualization widgets onto the canvas. These widgets connect to your data sources and update dynamically, offering real-time insights to end users. The tool also supports customization through properties and events, enabling you to tailor the look and feel of the dashboards to perfectly integrate with your application's design.
The DevExpress BI Dashboard 24.1 release adds support for cascading parameters. This powerful feature allows you to create intuitive filter hierarchies within your dashboards. Imagine selecting a value in a parent parameter, then watching as the options in a dependent parameter automatically update to reflect the chosen filter. This eliminates the need for users to manually navigate through potentially overwhelming dropdown lists, fostering a more focused and efficient experience. Cascading parameters empower you to design dashboards that guide users towards deeper insights within your data.
To see a full list of what's new in version 24.1, see our release notes.
DevExpress BI Dashboard is included as part of DevExpress Universal which is licensed per developer and is available as a Perpetual License with a 12 month support and maintenance subscription. See our DevExpress Universal licensing page for full details.
DevExpress BI Dashboard is available in the following products:

A pivot grid is a data visualization tool that allows users to interactively explore and summarize multidimensional data. By dragging and dropping fields between rows, columns, and filters, developers can empower users to dynamically create custom views of their data, facilitating data analysis and informed decision-making without writing complex queries.
Several React UI suites feature a pivot grid control including:
For an in-depth analysis of features and price, visit our React UI Suites comparison.


Tel.: (888) 850 9911
Fax: +1 770 250 6199


