








Offizieller Lieferant
Als offizieller und autorisierter Distributor beliefern wir Sie mit legitimen Lizenzen direkt von mehr als 200 Softwareherstellern.
Sehen Sie alle unsere Marken.
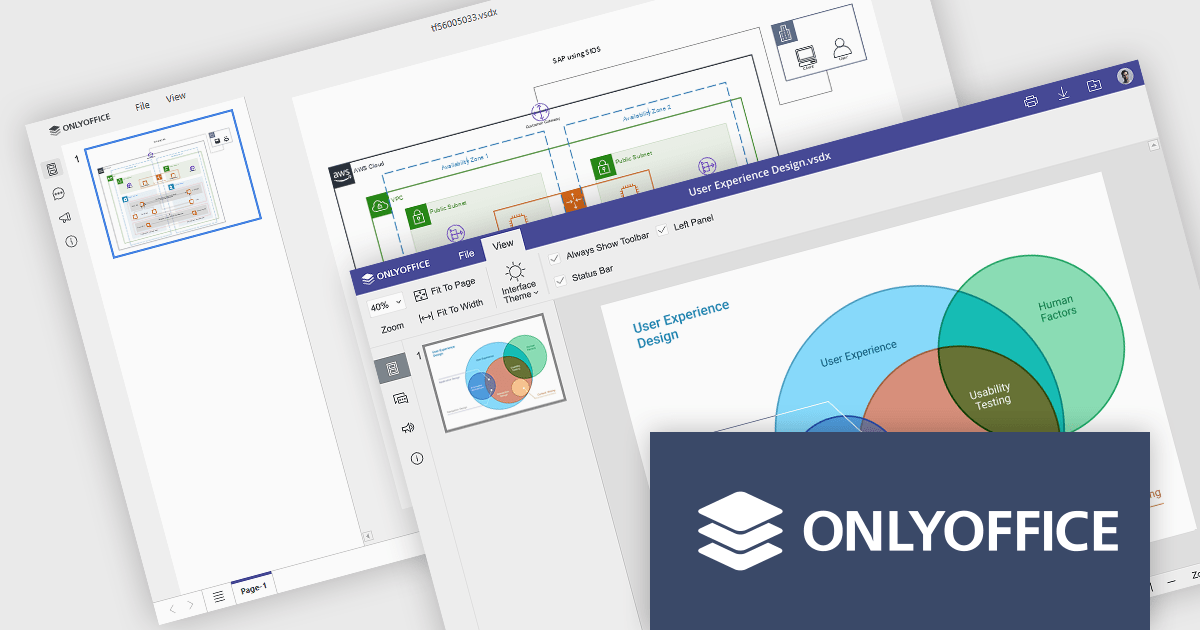
ONLYOFFICE Docs is a comprehensive online editor, allowing users to create text documents, spreadsheets, presentations, and forms. It enables your users to edit, share, and collaborate on documents online in their preferred browser, within your own application. It is fully compatible with OOXML (Office Open XML) formats and supports popular Microsoft Office and other document formats such as CSV, DOC, DOCX, EPUB, HTML, ODP, ODS, ODT, PDF, PPT, PPTX, RTF, TXT, XLS, and XLSX.
The ONLYOFFICE Docs v9.0 update adds a multi-platform integrated Diagram Viewer tool that allows users to view and navigate Microsoft Visio (.vsdx) files natively across devices, on web, desktop, and mobile web platforms, without requiring third-party software. With intuitive controls, zooming and panning, it provides effortless navigation whilst visualizing ideas and workflows as diagrams. Whether an IT manager is mapping infrastructure or a student is presenting a flowchart, the viewer ensures ideas and systems are clearly communicated.
To see a full list of what's new in v9.0.0, see our release notes.
ONLYOFFICE Docs is licensed by the number of simultaneous document connections and is available as an annual license with 1 year support and upgrades. See our ONLYOFFICE Docs licensing page for full details.
For more information, see our ONLYOFFICE Docs product page.
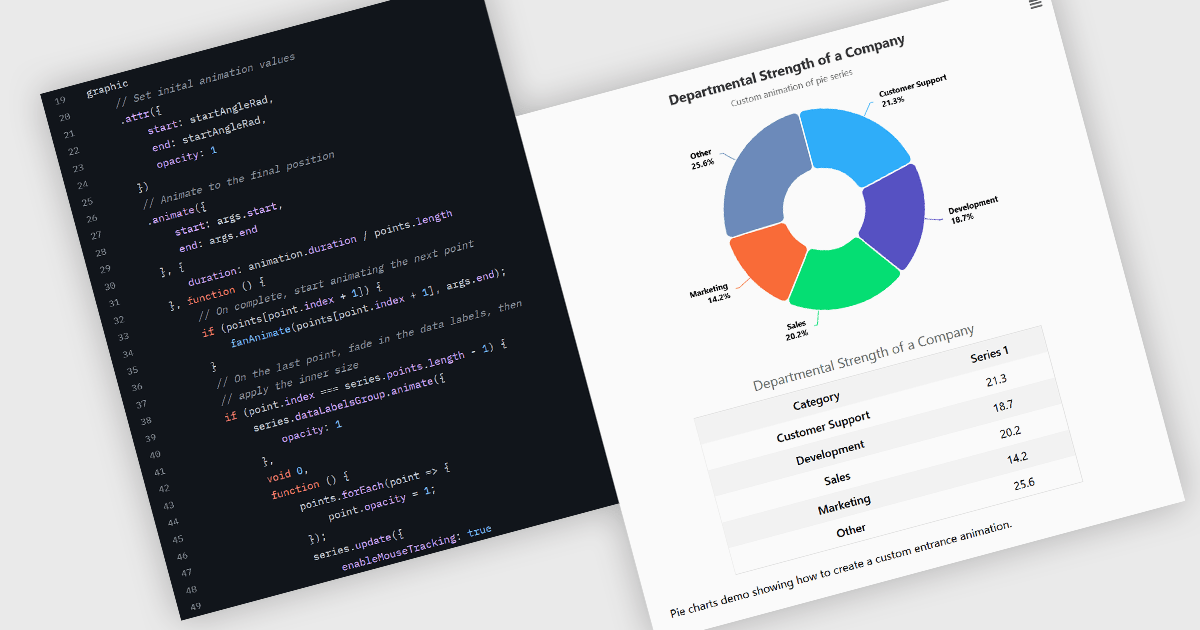
Animation in charts is a feature used in data visualization to visually transition between different data states or configurations. This technique helps communicate changes in data over time or between user interactions in a smooth, progressive manner. Rather than instantly switching from one state to another, animation introduces motion that can guide users’ attention, reinforce patterns, and reduce confusion. It is particularly useful in interactive dashboards and real-time analytics, where users benefit from a clearer understanding of what has changed and how.
Several Vue.js charting components support the use of animations, including:
For an in-depth analysis of features and price, visit our comparison of Vue.js chart components.
SpreadJS is a high-performance JavaScript spreadsheet and data presentation component designed for enterprise web applications. It enables developers to deliver Excel-like functionality directly within their web solutions, providing advanced features such as data binding, complex calculations, pivot tables, charts, and extensive formatting options. Fully compatible with modern JavaScript frameworks like React, Angular, and Vue, SpreadJS allows seamless integration and customization, empowering development teams to create interactive, data-driven user experiences without relying on external spreadsheet applications.
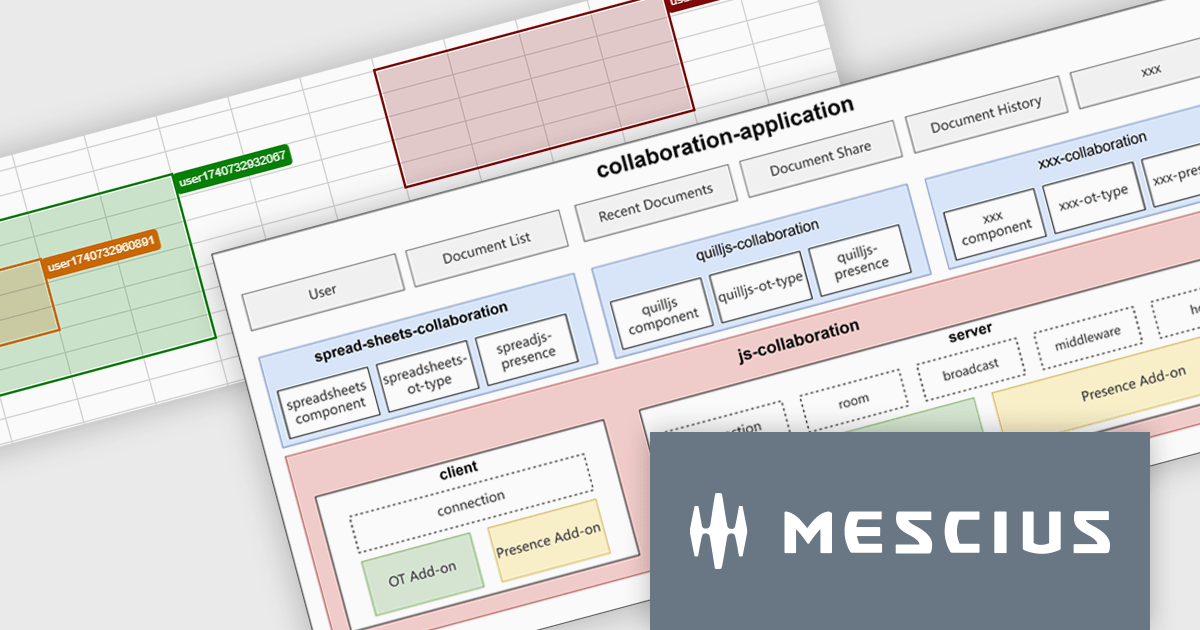
SpreadJS enables real-time collaboration within JavaScript spreadsheet applications through a modular, extensible framework currently available as a Developer Preview. This feature allows multiple users to work on the same spreadsheet simultaneously, maintaining data consistency and reducing the complexity of building collaborative functionality from scratch. It supports low-latency data synchronization, user presence indicators, and conflict-free concurrent editing, allowing multiple users to work simultaneously while maintaining consistent data states. Designed to integrate with various document types and backend systems, it simplifies the development of collaborative features without requiring developers to build the infrastructure from scratch. An online collaboration demo is available to explore these capabilities in action.
SpreadJS is licensed per developer and includes 1 Year Maintenance (major and minor version releases and unlimited support phone calls). SpreadJS requires an Annual or Perpetual Deployment License. The optional Add-ons are available at an additional cost, and require a SpreadJS license. See our SpreadJS licensing page for full details.
For more information, visit our SpreadJS product page.
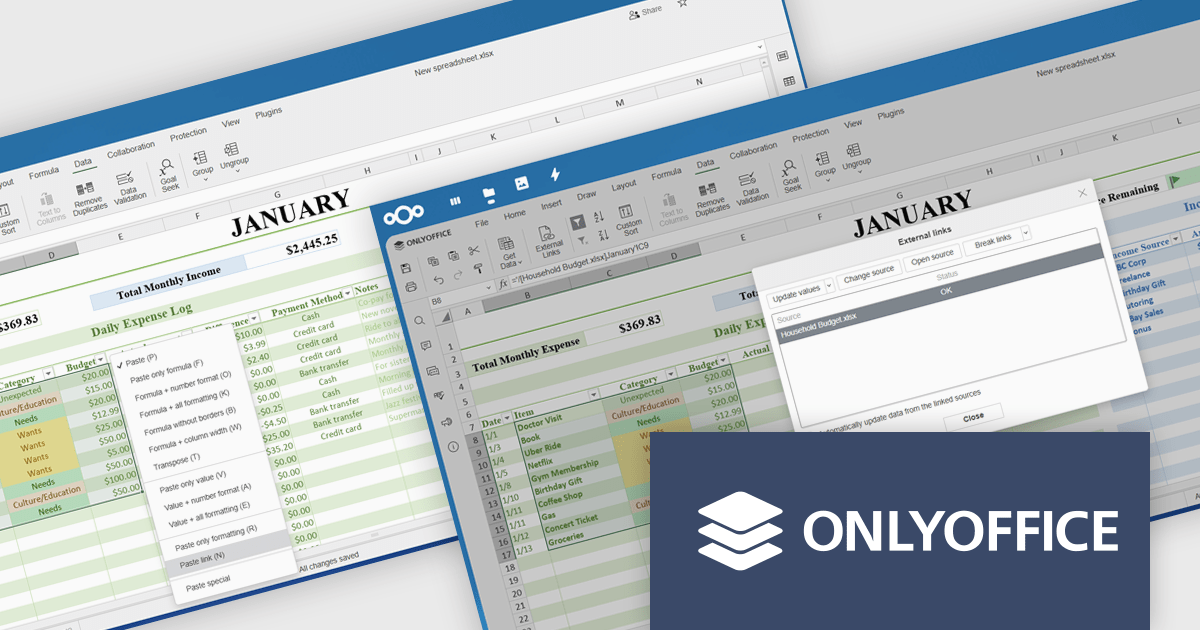
ONLYOFFICE Docs Enterprise Edition integrates seamlessly with both ownCloud and Nextcloud connectors, combining a powerful online document editor with two leading on-premises content collaboration platforms. This integration allows teams to create, view, edit, and collaborate on spreadsheets, presentations, and text documents in real time, directly within their ownCloud or Nextcloud environments, boosting productivity and eliminating the need to switch between applications.
The latest updates for the ONLYOFFICE Nextcloud and ownCloud connectors (9.9.0 and 9.9.1 respectively) introduce support for importing reference data into spreadsheets using external links, allowing developers to dynamically integrate data from third-party sources directly into their ONLYOFFICE spreadsheets. This enhancement simplifies cross-document referencing by enabling users to pull specific cell ranges from external files, reducing manual data handling and improving consistency across documents. It also supports automatic data updates and source management, helping developers maintain accurate, synchronized datasets within collaborative environments hosted on Nextcloud or ownCloud.
To see a full list of what's new, see our release notes for ONLYOFFICE Nextcloud Connector v9.9.0 and ONLYOFFICE ownCloud Connector v9.9.1.
The ONLYOFFICE Nextcloud and ownCloud connectors are both licensed per server and are available as an annual license with 1 year of support and updates, or as a perpetual license with 3 years of support and updates. See our licensing pages for the Nextcloud and ownCloud connectors for full details.
For more information, see our product pages:
SurveyJS is a family of extensible JavaScript libraries designed to help developers build robust form management systems fully integrated into their web applications. These libraries work seamlessly with any backend system and are fully compatible with modern JavaScript frameworks, including React, Angular, and Vue.
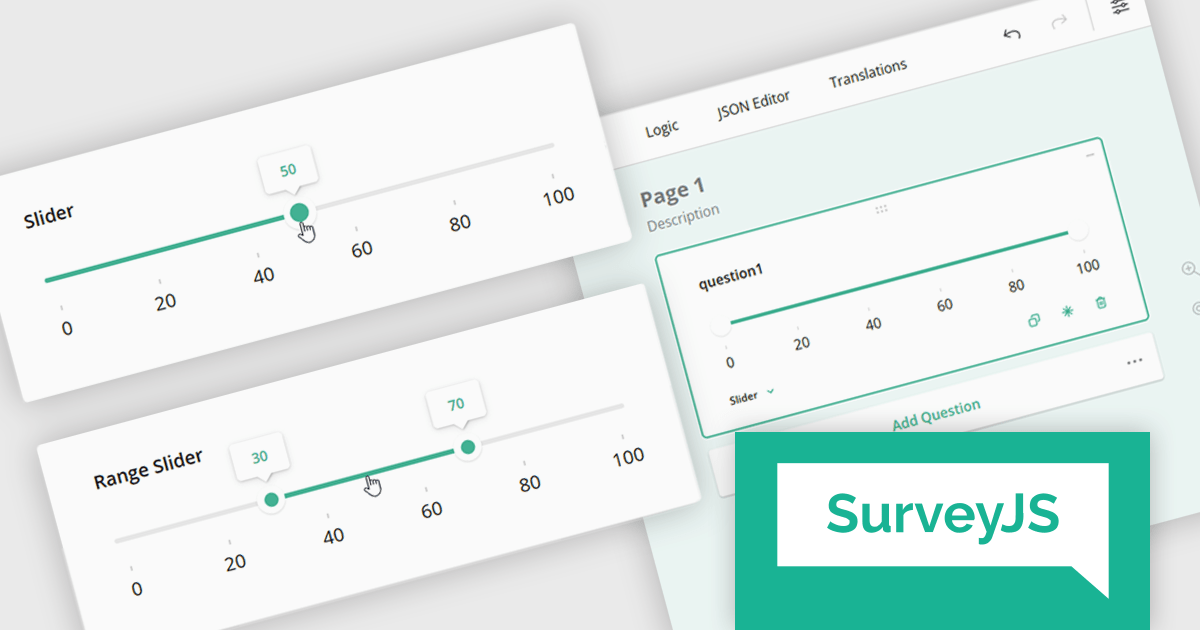
The SurveyJS 2.2.0 update introduces new Slider and Range Slider question types that enable developers to implement more interactive and precise input mechanisms within surveys. These components support a wide range of configuration options, including customizable minimum and maximum values, step sizes, labeled scales, and tooltip formatting. The Range Slider further enhances flexibility by allowing respondents to select and drag a value range using dual thumbs, with optional constraints on range length. Both question types can be seamlessly bound to text input fields, offering a more responsive and accessible data collection experience in custom survey workflows.
To see a full list of what's new in version 2.2.0, see our release notes.
SurveyJS is licensed per developer with a one-time payment for indefinite use. Access to updates and technical support is available through a subscription. See our SurveyJS Survey Creator licensing page for full details.
Learn more on our SurveyJS Survey Creator product page.





Tel.: (888) 850 9911
Fax: +1 770 250 6199


