


Offizieller Lieferant
Als offizieller und autorisierter Distributor beliefern wir Sie mit legitimen Lizenzen direkt von mehr als 200 Softwareherstellern.
Sehen Sie alle unsere Marken.
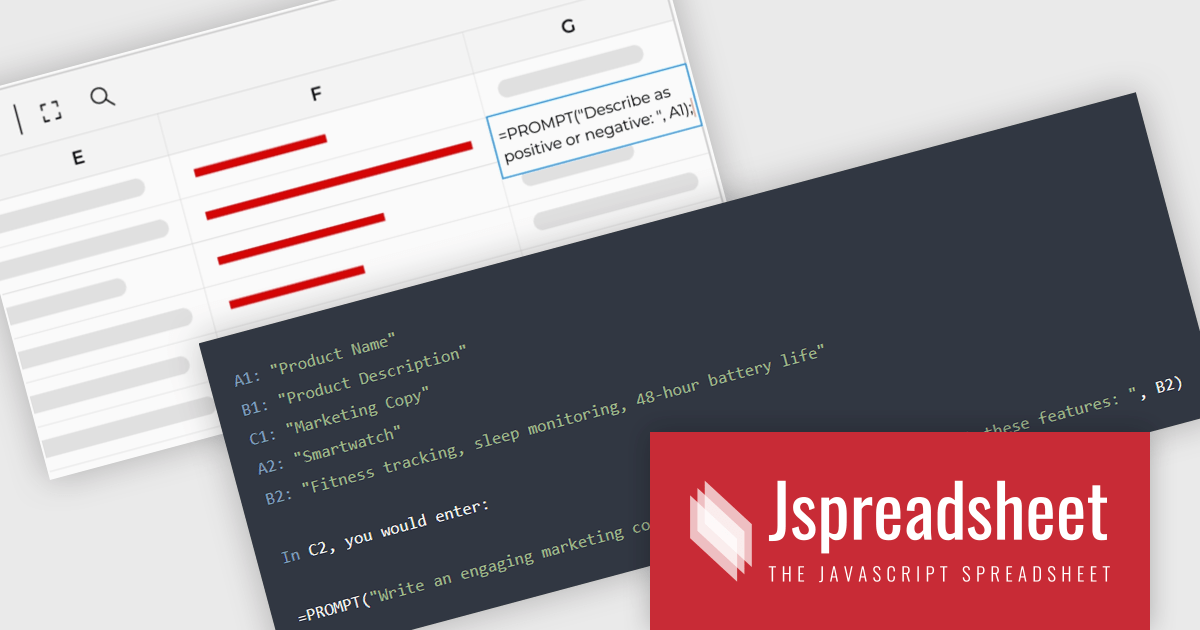
Jspreadsheet Pro is a flexible JavaScript-based spreadsheet solution that enables developers to create customizable, feature-rich data grids for web applications. It offers advanced formulas, data validation, and API integrations. Ideal for tasks like financial modeling, inventory management, and project tracking, it helps businesses efficiently manage and analyze data. Its backend server integration supports real-time data processing, enhancing workflows and boosting productivity across various industries.
Jspreadsheet Pro seamlessly incorporates ChatGPT API into data grids. This integration facilitates automated content generation, efficient response management, and comprehensive data analysis. For full functionality it requires the Jspreadsheet Server extension which enables front-end queries to communicate with the API via your back-end, delivering real-time data and insights to users.
Jspreadsheet Pro is licensed as an Annual or a Perpetual License with support and maintenance. We can supply any Jspreadsheet Pro license including new licenses, maintenance renewals, and upgrade licenses. See our Jspreadsheet Pro for full details.
For more information, visit our Jspreadsheet Pro product page.

jQWidgets is a comprehensive JavaScript UI framework offering a robust collection of over 60 widgets, themes, and utilities for building professional-grade, cross-platform web applications. Built on jQuery, HTML5, and CSS, it provides extensive functionality including data grids, charts, navigation, input validation, and more. jQWidgets simplifies web development, ensuring your applications work seamlessly across desktop browsers, tablets, and smartphones.
The jQWidgets v20.0.0 release introduces AI-powered sentence completion in its input component, enhancing user efficiency by suggesting autocompletions for full sentences based on context and how it has been configured.
To see a full list of what's new in v20.0.0, see our release notes.
jQWidgets is licensed per developer and is available as a Perpetual license 1 year support and maintenance. See our jQWidgets licensing page for full details.
Learn more on our jQWidgets product page.
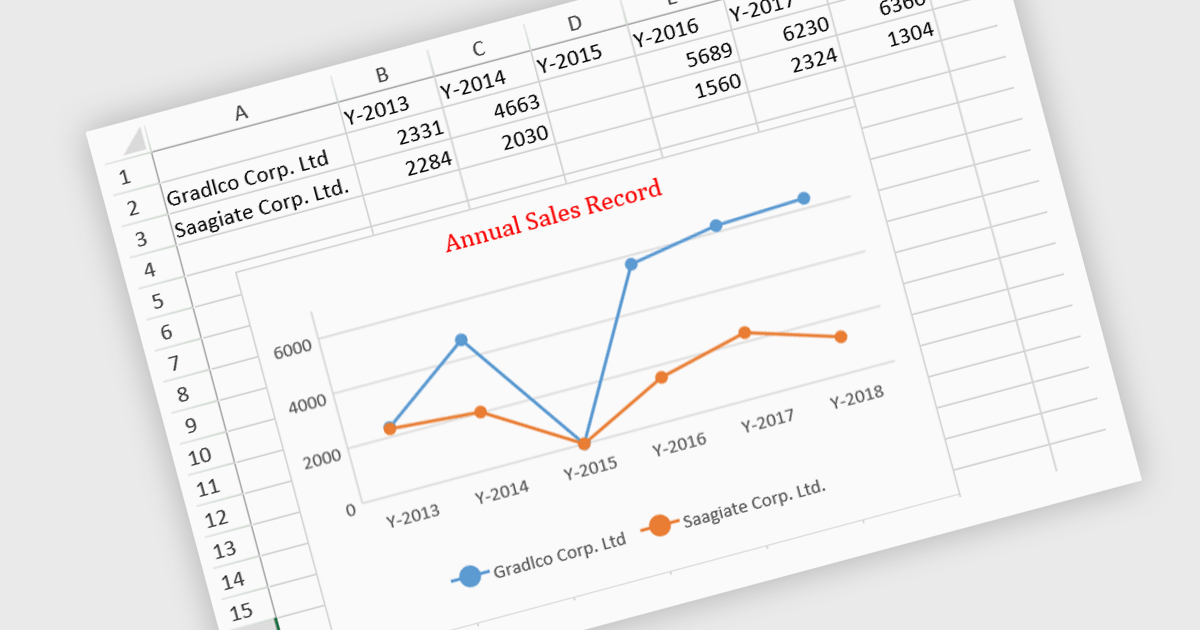
JavaScript spreadsheet controls with built-in chart features enable developers to visualize data directly within web-based spreadsheet applications. These charts are generated dynamically from the data within the spreadsheet, providing users with a more intuitive way to analyze and interpret complex datasets. By integrating charting capabilities, developers can offer real-time data visualization without relying on external libraries, resulting in more efficient user experiences. This functionality improves data-driven decision-making, enhances user engagement, and reduces the complexity of handling complex datasets in web applications.
Several JavaScript spreadsheet controls offer charts including:
For an in-depth analysis of features and price, visit our comparison of JavaScript Spreadsheet controls.
Smart UI (formerly known as Smart HTML Elements) is an enterprise-grade UI library offering pre-built web components for developers in Angular, React, Vue, Blazor, and JavaScript. It boasts over 60 ready-to-use components like grids, charts, schedulers, and editors, all featuring two-way data binding, responsiveness, accessibility, and theming capabilities. This library helps developers rapidly build dynamic and modern web applications with consistent look-and-feel and rich functionalities, accelerating development time and ensuring professional quality.
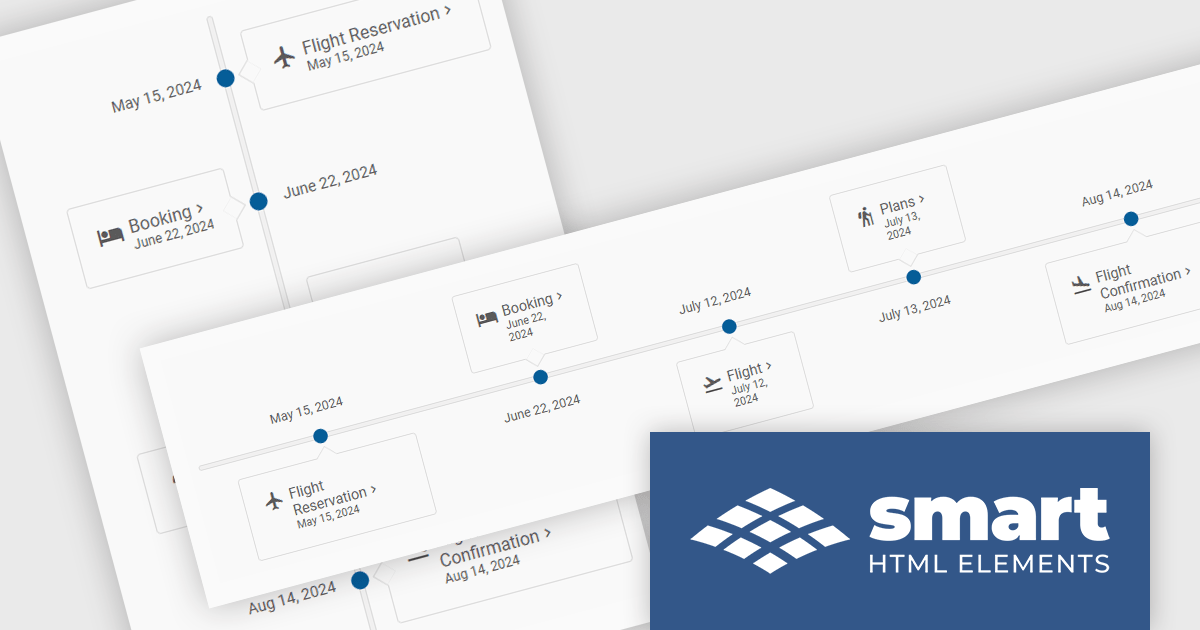
The Smart UI v20.0.0 release includes a new Timeline component which allows you to show a chronological collection of events. You can render the timeline in vertical or horizontal layouts and it can be customized with CSS, enabling you to style it to match your application's branding.
To see a full list of what's new in v20.0.0, see our release notes.
Smart UI (Smart HTML Elements) is licensed per developer and is available as a perpetual license with 1 year support and maintenance. It includes distribution to unlimited Web applications, SaaS projects, Intranets and Websites. Team, OEM and Enterprise licensing options are also available. See our Smart UI licensing page for full details.
Learn more on our Smart UI product page.
Syncfusion Essential Studio JavaScript, available as part of Syncfusion Essential Studio Enterprise, is a comprehensive UI library offering over 80 high-performance, lightweight, and responsive components to transform your web apps. Built from scratch with TypeScript, it boasts modularity and touch-friendliness, letting you pick and choose specific features while ensuring smooth mobile interaction. With rich themes, global accessibility features, and extensive documentation, it powers everything from basic buttons to interactive charts and data grids, simplifying frontend development across JavaScript, Angular, React, and Vue.
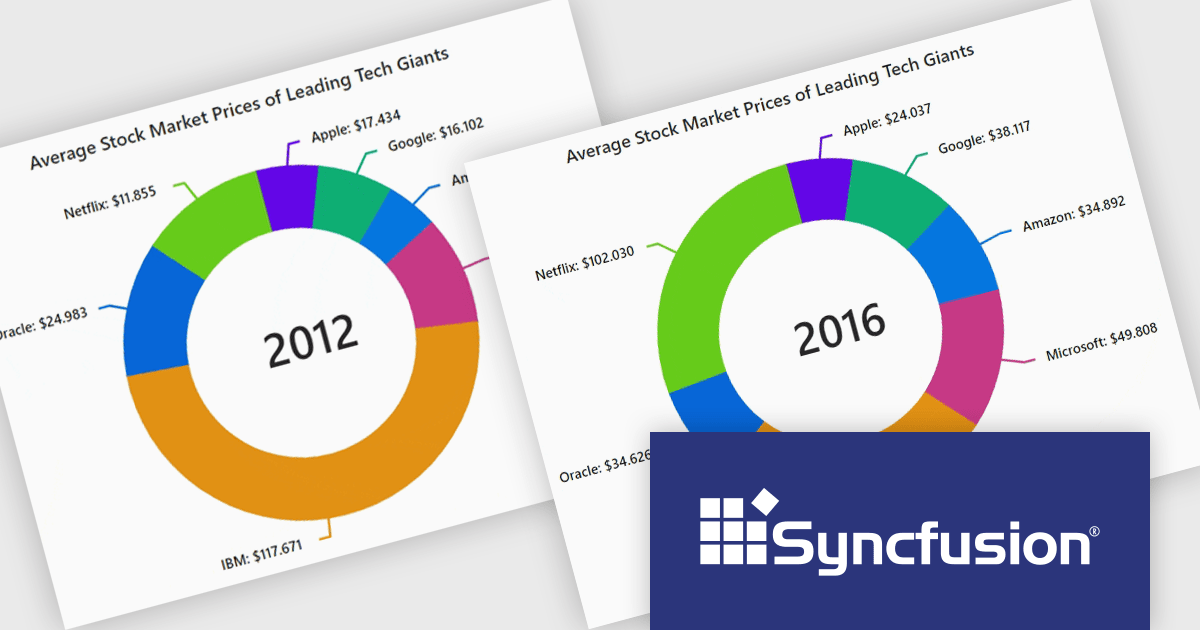
The Syncfusion Essential Studio JavaScript 2024 Volume 3 release adds the new accumulation charts animation feature which significantly enhances the user experience with smooth transitions. This creates a more dynamic and visually engaging interface, allowing users to interact with charts in real-time without abrupt changes. The fluid animations extend to series, data labels, and legends, providing a cohesive and polished look that improves the overall clarity and understanding of data updates. By reducing visual disruption, this feature makes data-driven insights more accessible and keeps users focused on the evolving information.
To see a full list of what's new in version 2024 Volume 3, see our release notes.
Syncfusion Essential Studio JavaScript is available as part of Syncfusion Essential Studio Enterprise which is licensed per developer starting with a Team License of up to five developers. It is available as a 12 Month Timed Subscription License which includes support and maintenance. See our Syncfusion Essential Studio Enterprise licensing page for full details.
For more information, visit our Syncfusion Essential Studio JavaScript product page.


Tel.: (888) 850 9911
Fax: +1 770 250 6199


