








Offizieller Lieferant
Als offizieller und autorisierter Distributor beliefern wir Sie mit legitimen Lizenzen direkt von mehr als 200 Softwareherstellern.
Sehen Sie alle unsere Marken.
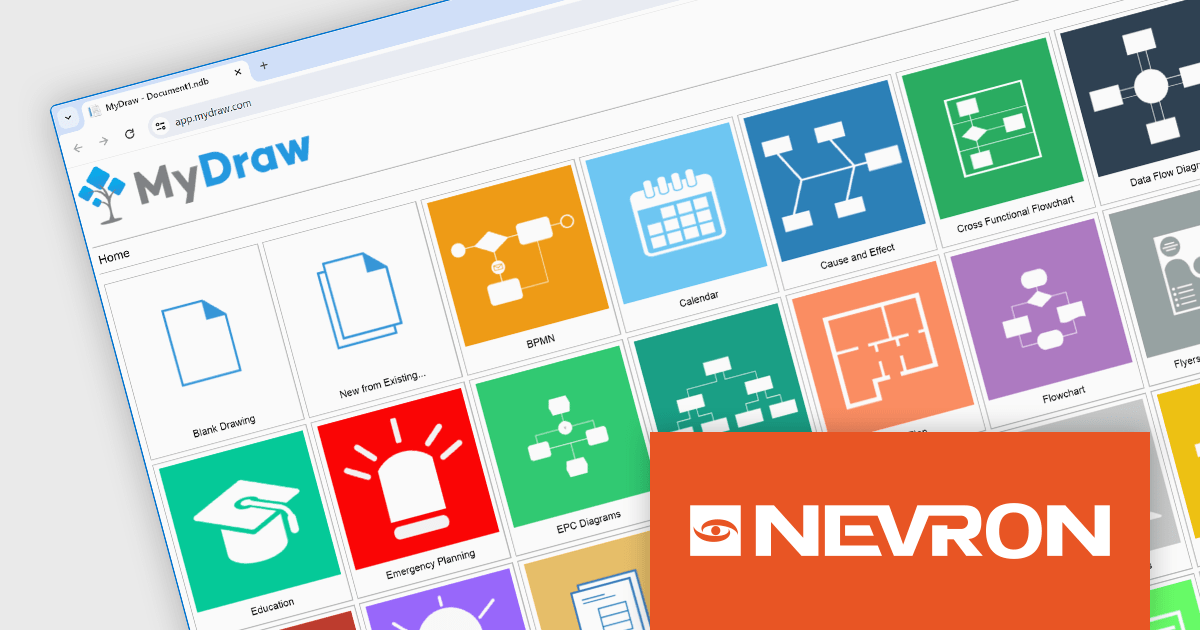
MyDraw by Nevron is a powerful diagramming and vector graphics tool that empowers developers to create a wide range of visual aids, from flowcharts and network diagrams to software architecture illustrations. Its user-friendly, Office-inspired interface simplifies the learning curve, while the extensive collection of tools fosters intuitive vector drawing. MyDraw boasts a vast library of shapes and connectors, equipped with intelligent functionality similar to Microsoft Visio's smart shapes. It seamlessly integrates with Visio, allowing users to open, edit, and save drawings in VSD, VDX, and VSDX formats.
The MyDraw V6.0 release adds a new web-based version accessible through any modern browser, offering the same powerful diagramming and vector graphics creation features as the desktop applications for Windows and Mac. This innovative addition, built upon Nevron's cross-platform technology, allows users to create and edit diagrams directly in their web browser on any device, without the need for additional software. MyDraw's web version streamlines diagramming collaboration and facilitates on-the-go editing, boosting accessibility and promoting teamwork.
To see a full list of what's new in v6.0.0, see our release notes.
MyDraw is licensed per user and is available as a 12 months subscription license with free support. See our MyDraw licensing page for full details.
For more information, see our MyDraw product page.
GroupDocs.Comparison for Node.js via Java is a software development library that empowers developers using Node.js to integrate document comparison functionality into their applications. It acts as a bridge between the Node.js environment and the core GroupDocs.Comparison engine, written in Java. This allows developers to seamlessly leverage the robust comparison capabilities within their Node.js projects.
The library streamlines the process of identifying changes between various document formats, including Microsoft Office files (Word, Excel, PowerPoint), OpenDocument formats, PDFs, images, and more. Developers can use it to generate detailed reports highlighting differences at the paragraph, word, and character levels. It can also detect changes in styling and formatting, providing a comprehensive view of document revisions. These functionalities make GroupDocs.Comparison for Node.js via Java valuable for applications like version control systems, plagiarism checkers, and document review workflows.
GroupDocs.Comparison for Node.js via Java is offered as Developer Small Business, Developer OEM, Site Small Business, and Site OEM licenses catering to a range of business needs. Licenses are perpetual, and include 1 year of support and maintenance. Subscription renewals are also available. See our GroupDocs.Comparison for Node.js via Java licensing page for full details.
GroupDocs.Comparison for Node.js via Java is available in the following products:
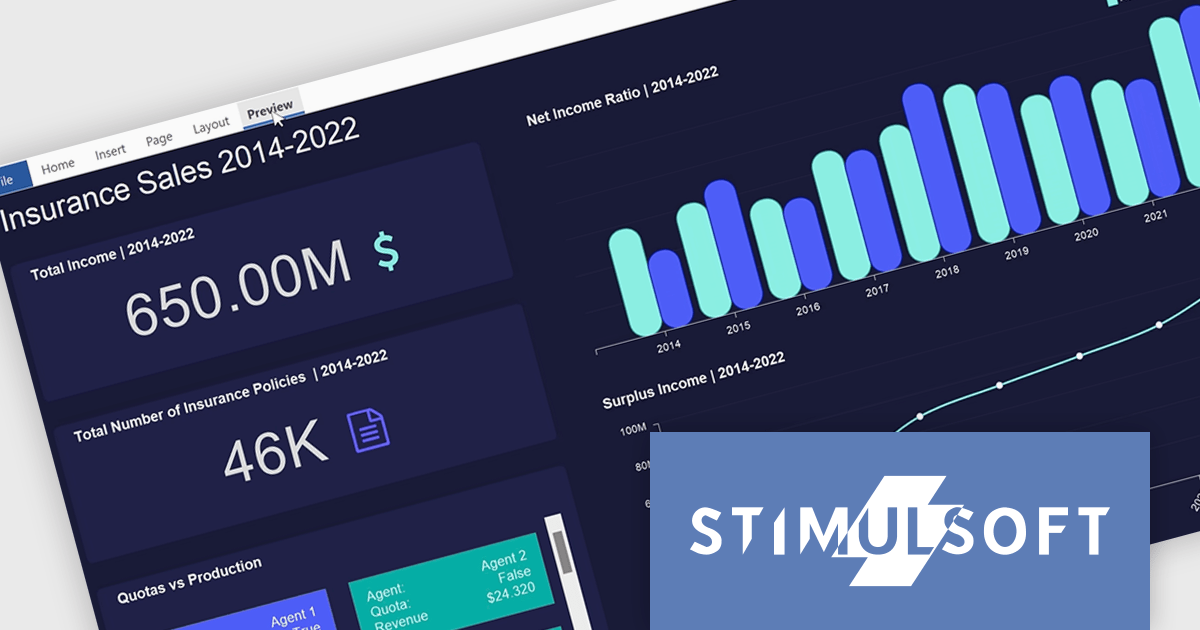
Stimulsoft Dashboards.PYTHON is a new data visualization tool specifically designed for building interactive dashboards within Python applications. It combines a client-side JavaScript engine for data processing with a designer component to craft dashboards and a viewer for displaying them. This empowers developers to create clear and informative visual representations of data directly within their Python projects.
Developers can leverage a rich set of pre-built widgets to construct dashboards that display data through charts, gauges, and other informative elements. These dashboards can be interactive, enabling users to filter data, drill down into specific details, and gain a deeper understanding of the information at hand. This makes Stimulsoft Dashboards.PYTHON a valuable tool for a wide range of use cases, from business intelligence and financial analysis to scientific data visualization and project management.
Stimulsoft Dashboards.PYTHON is licensed per developer and is available as a perpetual license with 1 year support and maintenance. See our Stimulsoft Dashboards.PYTHON licensing page for full details.
Stimulsoft Dashboards.PYTHON is available in the following products:
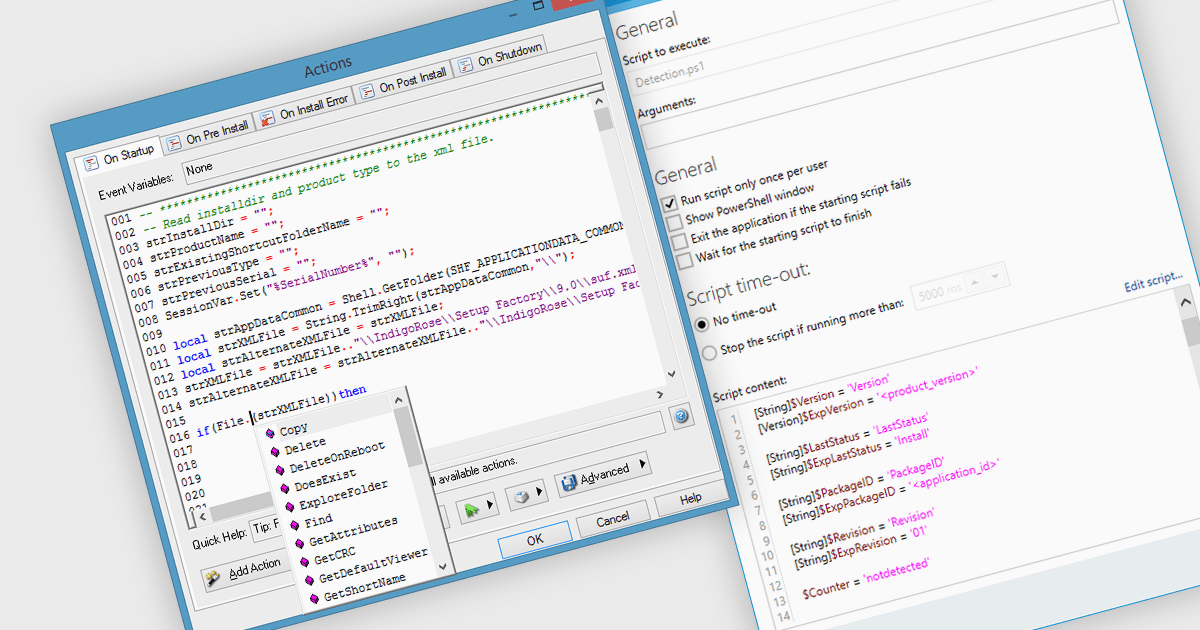
Installation tools leverage scripting to handle conditional logic, enabling the installation to adapt to different system configurations or user selections. Scripting plays a vital role in streamlining Windows installation tools. By employing languages like PowerShell or batch files, IT professionals can automate repetitive tasks during deployment, such as software installation, configuration adjustments, and user environment setup. This not only reduces manual effort and human error but also ensures consistency and efficiency in provisioning large numbers of Windows machines.
Several installation tools offer support for scripting, including:
For an in-depth analysis of features and price, visit our Installation Tools comparison.
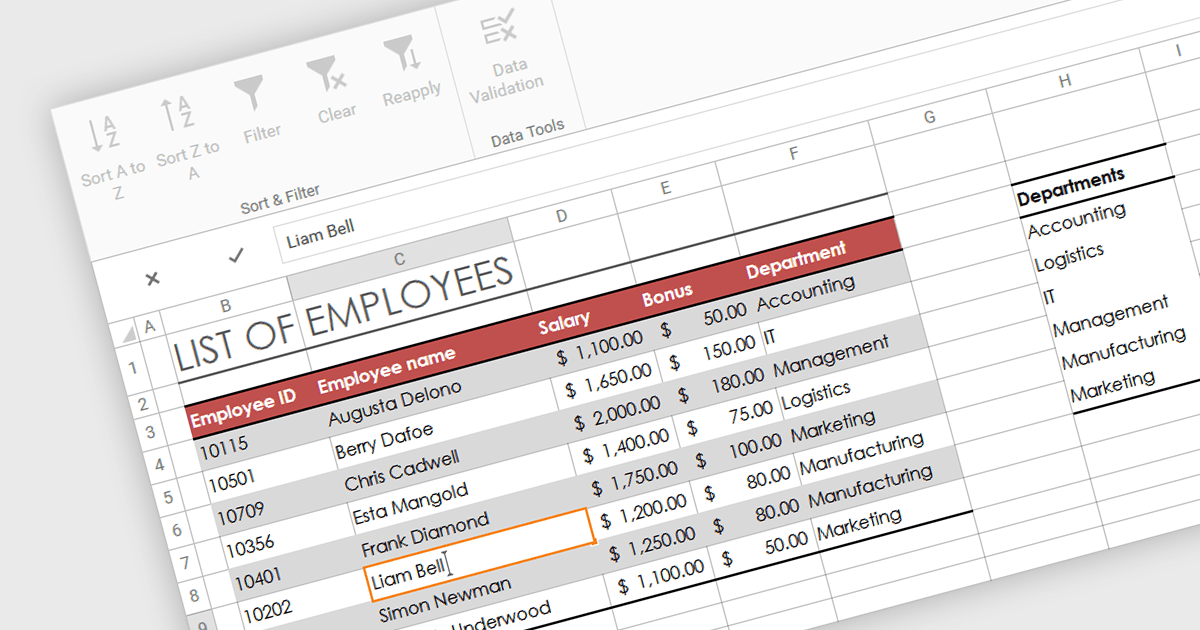
In-cell data editing refers to the functionality within spreadsheet software that allows users to directly click on and modify the contents of a cell without the need for separate data entry forms or pop-up dialogs. This feature allows for quicker and more direct changes to the data displayed on the screen, enhancing productivity by reducing the steps required for data manipulation.
Several .NET 8 WPF spreadsheet controls support in-cell data editing including:
For an in-depth analysis of features and price, visit our comparison of .NET 8 WPF Spreadsheet Controls.





Tel.: (888) 850 9911
Fax: +1 770 250 6199


