








Offizieller Lieferant
Als offizieller und autorisierter Distributor beliefern wir Sie mit legitimen Lizenzen direkt von mehr als 200 Softwareherstellern.
Sehen Sie alle unsere Marken.
IronWord for .NET empowers developers with a robust and efficient solution for handling Microsoft Word documents within their .NET applications. This C# library eliminates the need for complex Microsoft Office interop, offering a user-friendly API for generating, editing, and formatting DOCX files directly.
By leveraging IronWord for .NET, developers can seamlessly read, edit, and manipulate DOCX files within their .NET projects. Extract text and images, modify page layout elements like paper size and margins, and customize the visual appearance with background colors. Paragraph manipulation allows for adding, removing, and formatting text, incorporating images and shapes, and creating compelling bulleted and numbered lists.
IronWord for .NET also provides comprehensive table functionality. Manage rows and columns with ease, control cell values, merge or split cells for optimal organization, and customize borders with various properties. This extensive feature set empowers developers to seamlessly integrate powerful Word document processing functionalities into their .NET applications, streamlining workflows and enhancing development efficiency.
IronWord for .NET is licensed based on the number of developers, organization locations and projects, and is available as a Perpetual license with one free year of product updates and support services. See our IronWord for .NET licensing page for full details.
IronWord for .NET is available to buy in the following products:
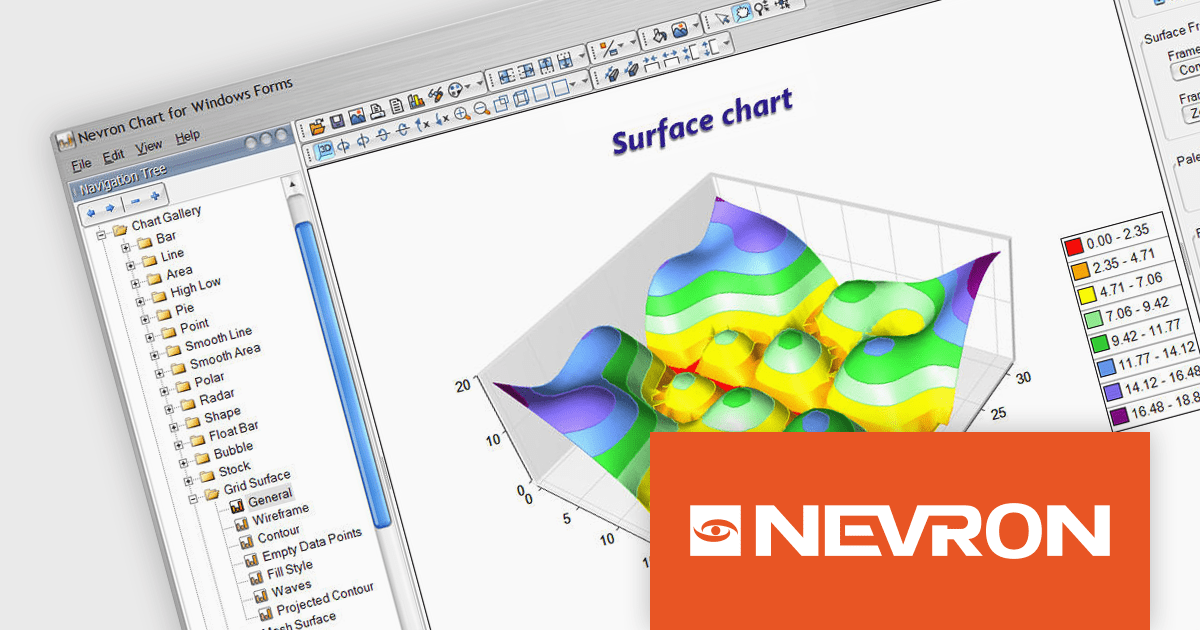
Nevron Chart for .NET is an advanced component suite designed for developers to add rich charting functionality to WinForms, WPF, ASP.NET and MVC applications. Covering any data visualization requirements it is an ideal solution for developing charting enabled presentation, business, scientific or financial applications. It boasts hardware acceleration for optimal performance, a flexible API for customization, and advanced interactivity features like zooming, panning, and tooltips to enhance user engagement with your data.
Nevron Chart for .NET 2024.1 adds support for Microsoft .NET Core 8.0 for the WinForms and WPF chart controls. This enables developers to leverage the latest features and performance improvements offered by the .NET ecosystem in their existing .NET applications, while still utilizing the comprehensive charting capabilities of Nevron Chart.
To see a full list of what's new in 2024.1, see our release notes.
Nevron Chart for .NET is licensed per developer machine and is available as a perpetual license with 1 year subscription and support. See our Nevron Chart for .NET licensing page for full details.
Nevron Chart for .NET is available to buy in the following products:
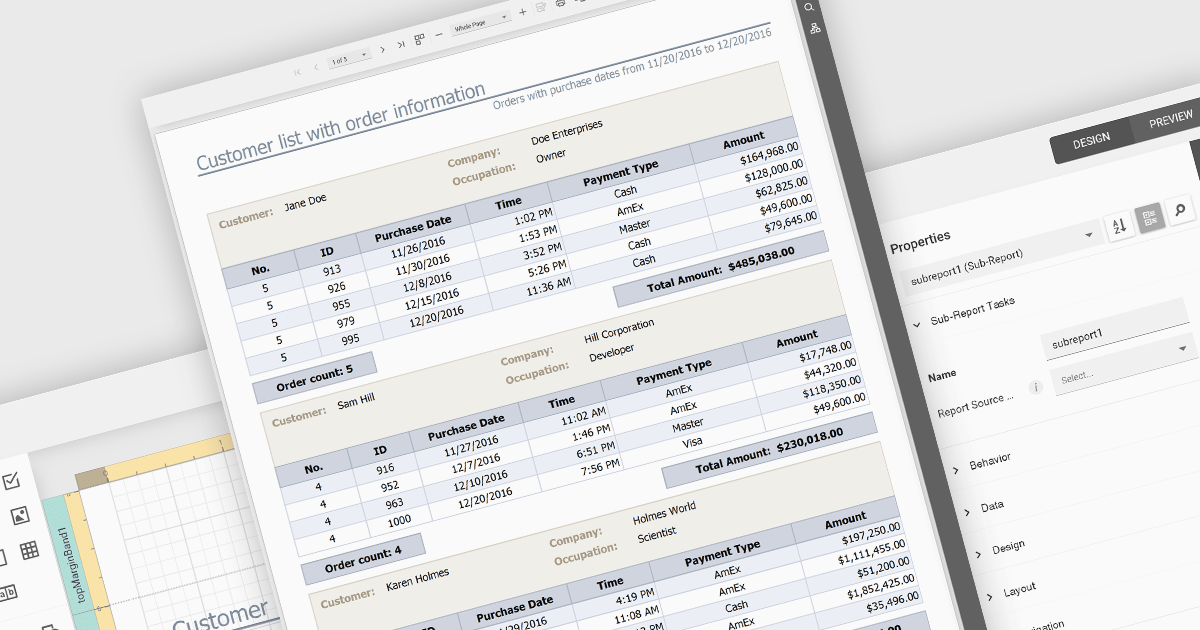
Subreports let you combine smaller reports into one, allowing you to present hierarchical or related data in a structured manner. They effectively function as modular components within a larger report, enhancing data organization and clarity. Subreports are useful for displaying detailed information associated with a main report's record, such as order items within an invoice or the sales history of a specific customer.
Several ASP.NET Core reporting controls offer support for subreports including:
For an in-depth analysis of features and price, visit our ASP.NET Core reporting controls comparison.
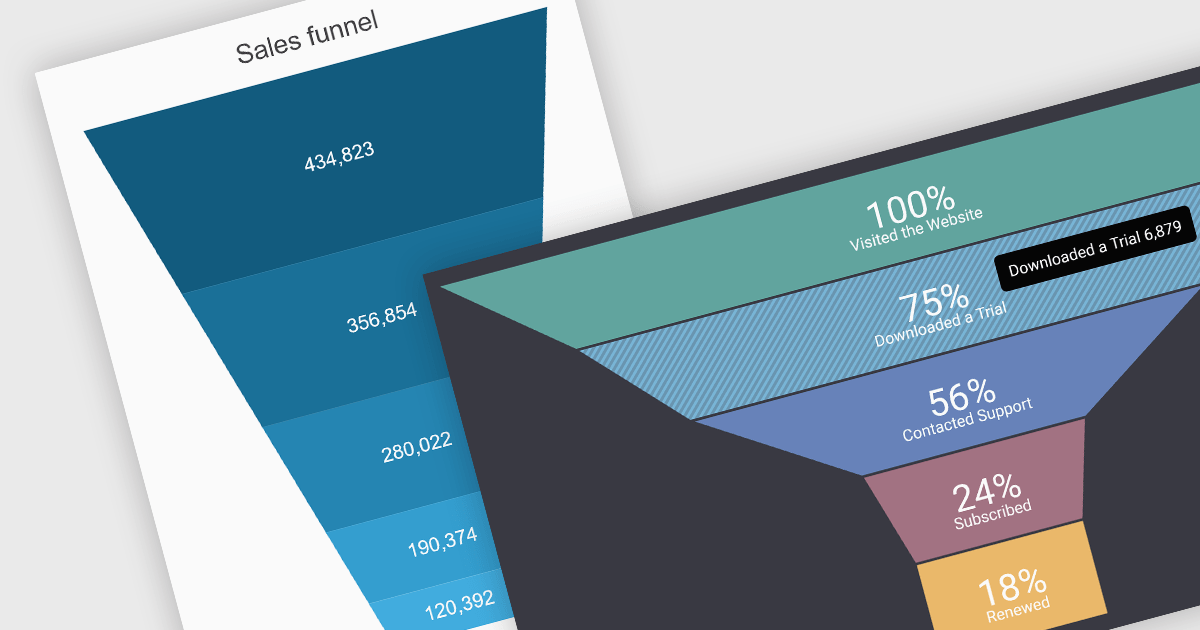
A funnel chart is a type of visualization that graphically depicts the stages of a process and the progressive flow of values through those stages. It gets its name from its shape, typically resembling a funnel with a wide top and narrow base. Funnel charts are particularly useful in sales and marketing contexts for tracking potential customers as they move through the sales pipeline, identifying bottlenecks, and pinpointing areas where performance might be improved.
Several jQuery chart controls offer Funnel charts including:
For an in-depth analysis of features and price, visit our jQuery chart controls comparison.
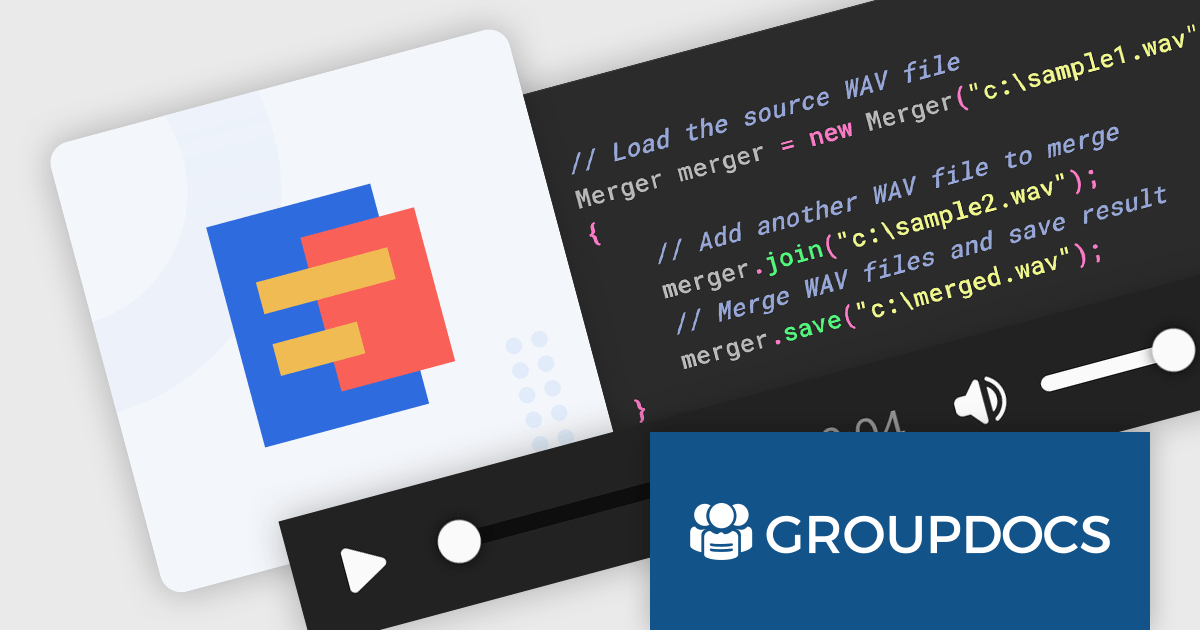
GroupDocs.Merger for Java is a software library designed to streamline document merging processes within Java applications. It enables developers to combine multiple files of various formats (Word, Excel, PDF, etc.) into a single, unified document. Additionally, the library offers features for splitting documents, reordering pages, and inserting OLE objects, making it a flexible tool for comprehensive document manipulation.
The GroupDocs.Merger for Java V24.2 release empowers developers to seamlessly merge WAV audio files directly within their Java applications. This eliminates the need to switch between external audio editing software, streamlining workflows and simplifying the creation of longer audio tracks, compositions, or consolidated recordings.
To see a full list of what's new in V24.2, see our release notes.
GroupDocs.Merger for Java is offered as Developer Small Business, Developer OEM, Site Small Business and Site OEM licenses catering to a range of business needs. Licenses are perpetual, and include 1 year of support and maintenance. Subscription renewals are also available. See our GroupDocs.Merger for Java licensing page for full details.
GroupDocs.Merger for Java is available in the following products:





Tel.: (888) 850 9911
Fax: +1 770 250 6199


