


Offizieller Lieferant
Als offizieller und autorisierter Distributor beliefern wir Sie mit legitimen Lizenzen direkt von mehr als 200 Softwareherstellern.
Sehen Sie alle unsere Marken.
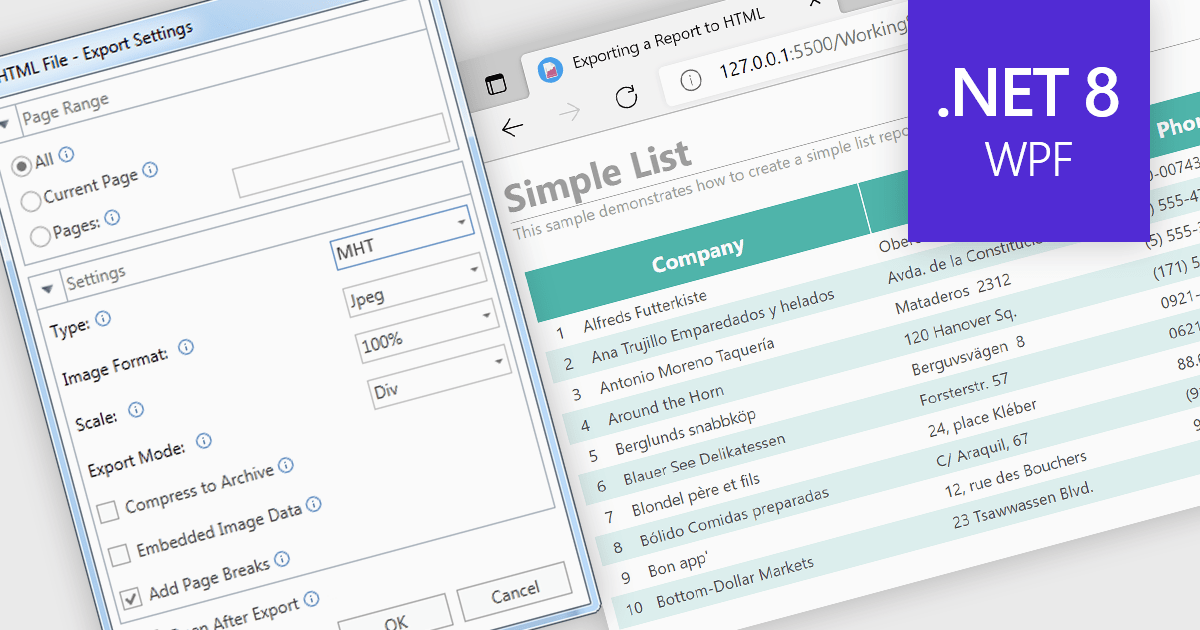
MHT (MHTML or MIME HTML) is a web archive format that bundles a web page's HTML code and all its resources such as images, stylesheets, and scripts into a single file that can be viewed offline or in applications that don't require an internet connection. Exporting to MHT format gives you a single archive file that contains your webpage and all its necessary components. This format is especially beneficial for preserving the exact state of a web page at a specific point in time, allowing for offline storage and easy sharing without losing the original design and functionality. Additionally, it simplifies the management and transfer of web content by consolidating multiple files into a single entity.
Several .NET 8 WPF reporting components allow you to export to MHT, including:
For an in-depth analysis of features and price, visit our comparison of .NET 8 WPF reporting components.
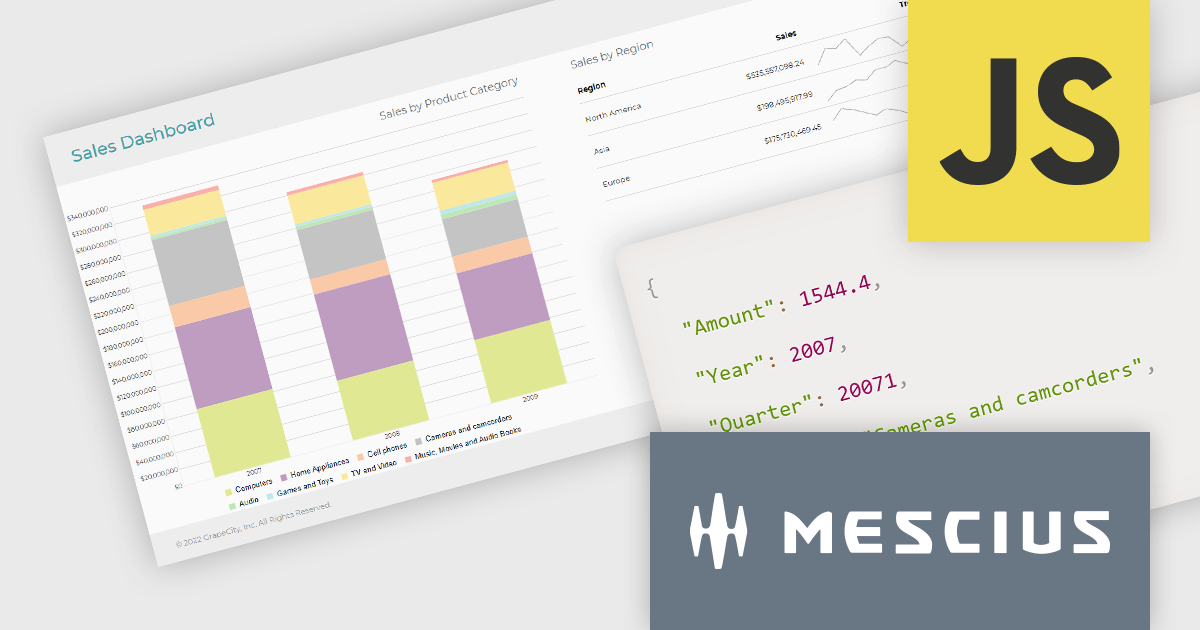
ActiveReportsJS is a reporting tool for web applications that allows developers and report authors to easily design and display reports within their applications. With a wide range of features, such as drill-down, runtime data filtering, and parameter-driven reports, as well as compatibility with popular frameworks, ActiveReportsJS simplifies the process of creating and managing reports.
In this blog post, MESCIUS Product Engineer Sergey Abakumoff demonstrates five performance tips that you can use when, for example, you need to bind a report to large volumes of data to display summary reports in a dashboard:
A demo project is included to demonstrate each tip in action.
Read the full blog to learn these performance-boosting tips.
ActiveReportsJS is licensed on an annual subscription or perpetual basis and is available as a Single Deployment License for non-commercial use, and as a Single Domain License or Unlimited Domain License for commercial and/or SaaS use. See our ActiveReportsJS licensing page for full details.
For more information, visit our ActiveReportsJS product page.
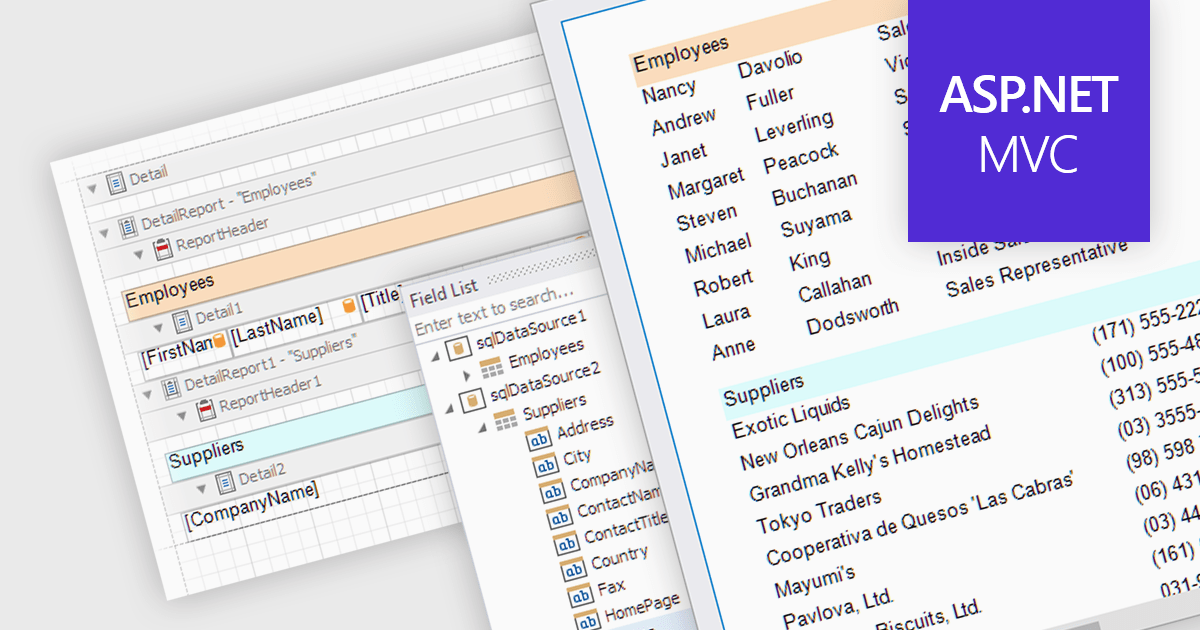
The ability to combine multiple data sources when creating a report is a critical aspect of modern data analytics and business intelligence. It allows for the creation of a holistic view by bringing together information from various databases, spreadsheets, or applications. Developers who integrate this into their reporting application enable their users to design reports that can be used to derive more accurate insights, make informed decisions, and identify trends or patterns that might not be evident when examining isolated data sets.
Several ASP.NET MVC report components allow you to combine multiple data sources, including:
For an in-depth analysis of features and price, visit our comparison of ASP.NET MVC report components.
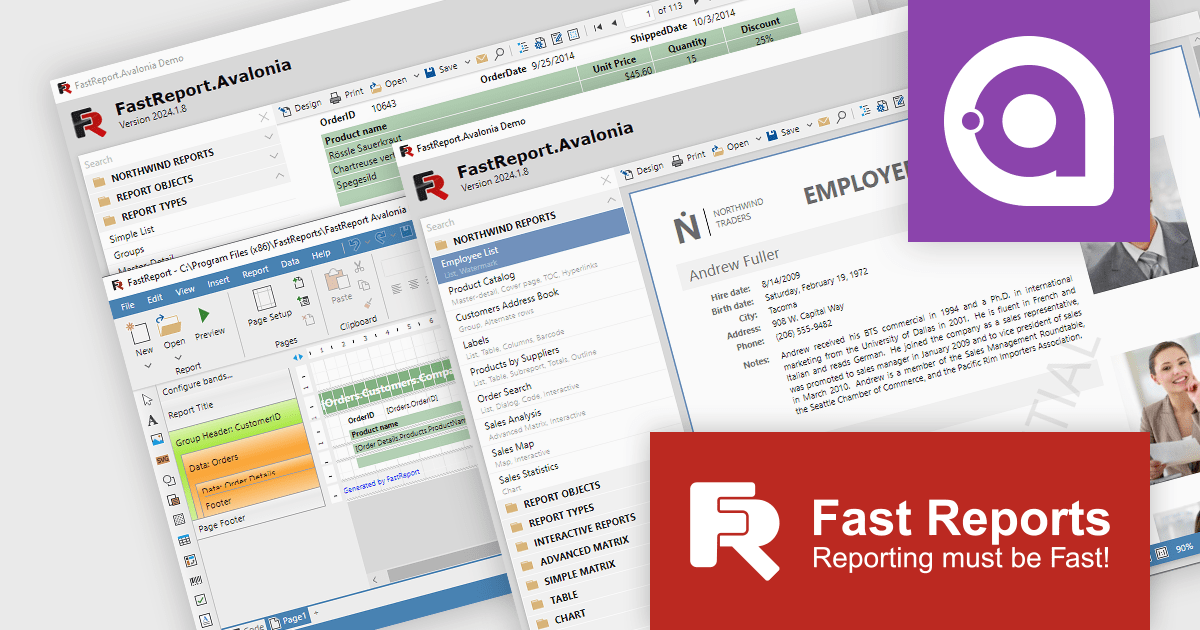
FastReport Avalonia empowers developers to design and generate informative reports within their Avalonia UI applications. This powerful tool offers a familiar visual editor for crafting reports like invoices and financial statements. It seamlessly integrates data processing and exports reports to various formats, including PDF and Excel. Notably, FastReport Avalonia maintains consistent functionality across multiple operating systems, ensuring a unified user experience for your application.
As the latest innovation from Fast Reports, FastReport Avalonia simplifies cross-platform report generation. This versatile component integrates effortlessly within your Avalonia UI application. Developers can create and export reports in various formats across Windows, macOS, and Linux, all from a single codebase. FastReport Avalonia boasts broad compatibility, supporting x64, x86, and even arm64 processor architectures, alongside .NET 6 and later versions. This flexibility empowers developers to leverage a single reporting solution across diverse development environments.
FastReport Avalonia is licensed per named user and is available as a Single Named, Team and Site License. See our FastReport Avalonia licensing page for full details.
Learn more on our FastReport Avalonia product page.
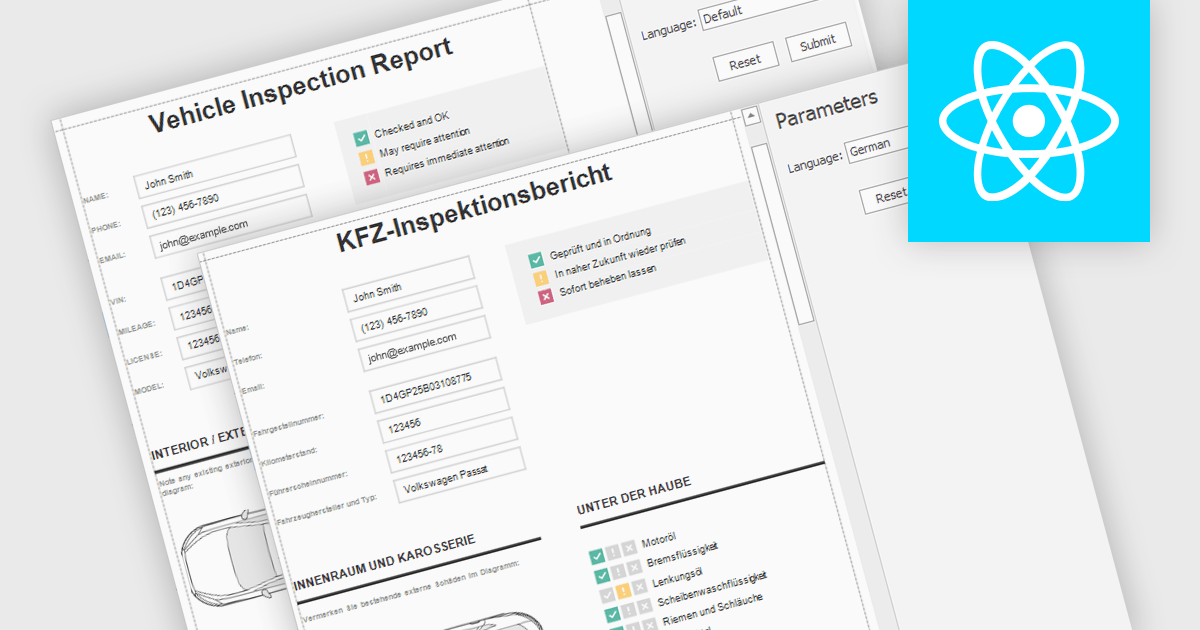
Report localization is the process of adapting a report for a target audience's language and cultural context. This involves translating text elements, formatting dates and currencies appropriately, and potentially adjusting the user interface to accommodate different reading habits such as right-to-left layouts. The goal is to ensure the report is clear, informative, and culturally sensitive for users worldwide.
Several React reporting controls offer localization including:
For an in-depth analysis of features and price, visit our React reporting controls comparison.


Tel.: (888) 850 9911
Fax: +1 770 250 6199


