








Offizieller Lieferant
Als offizieller und autorisierter Distributor beliefern wir Sie mit legitimen Lizenzen direkt von mehr als 200 Softwareherstellern.
Sehen Sie alle unsere Marken.
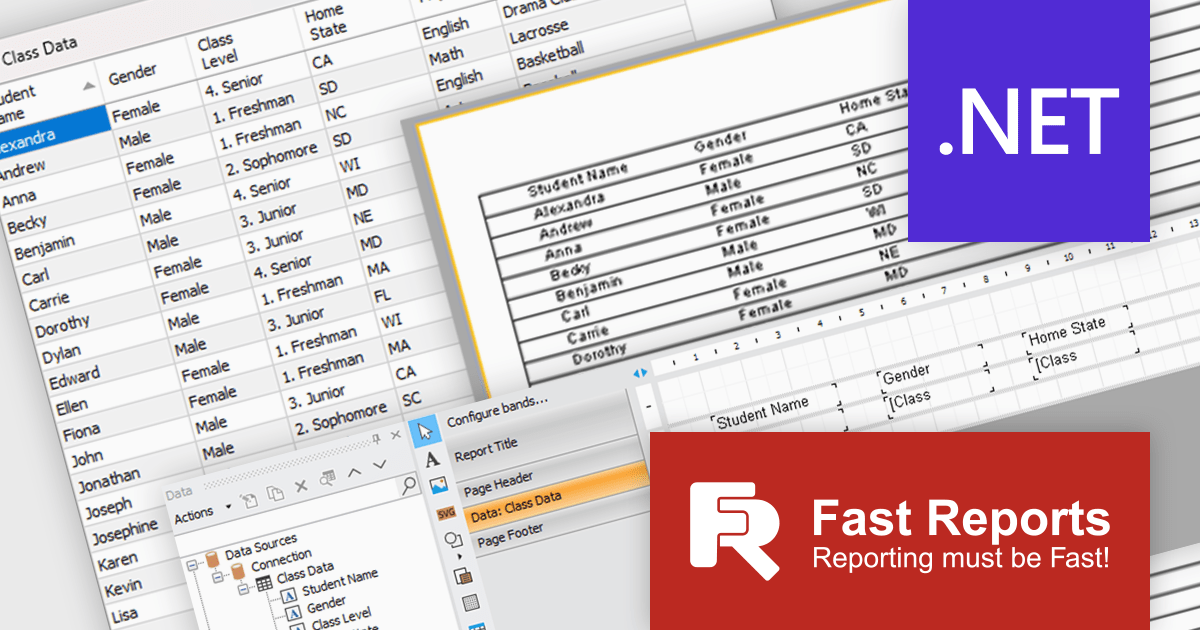
FastReport .NET Ultimate is a comprehensive reporting solution for developers working within the Microsoft .NET ecosystem. It supports the creation, design, and delivery of rich, interactive reports across Windows Forms, ASP.NET, MVC, and .NET Core applications. The Ultimate edition includes server deployment capabilities and extensive export options, such as PDF, Excel, Word, and HTML. It connects to various data sources, including SQL databases and business objects, providing flexibility for enterprise-level reporting. With the integrated FastReport Online Designer, users can edit reports directly in their browsers, enabling efficient collaboration and modern, full-featured report design across both desktop and web platforms.
The latest FastReport .NET Ultimate update introduces support for Google Sheets as a data source, allowing reports to connect directly to cloud-based spreadsheets. It enables developers and data professionals to work with up-to-date information without manual data transfers, making it easier to incorporate shared or frequently updated datasets into reports. It simplifies access to external data while maintaining the familiar reporting experience, making it particularly useful for teams already relying on Google Sheets for data management.
FastReport .NET Ultimate is licensed per named user and is available as a perpetual license with a one-year subscription for updates and support. See our FastReport .NET Ultimate licensing page for full details.
For more information, visit our FastReport .NET Ultimate product page.
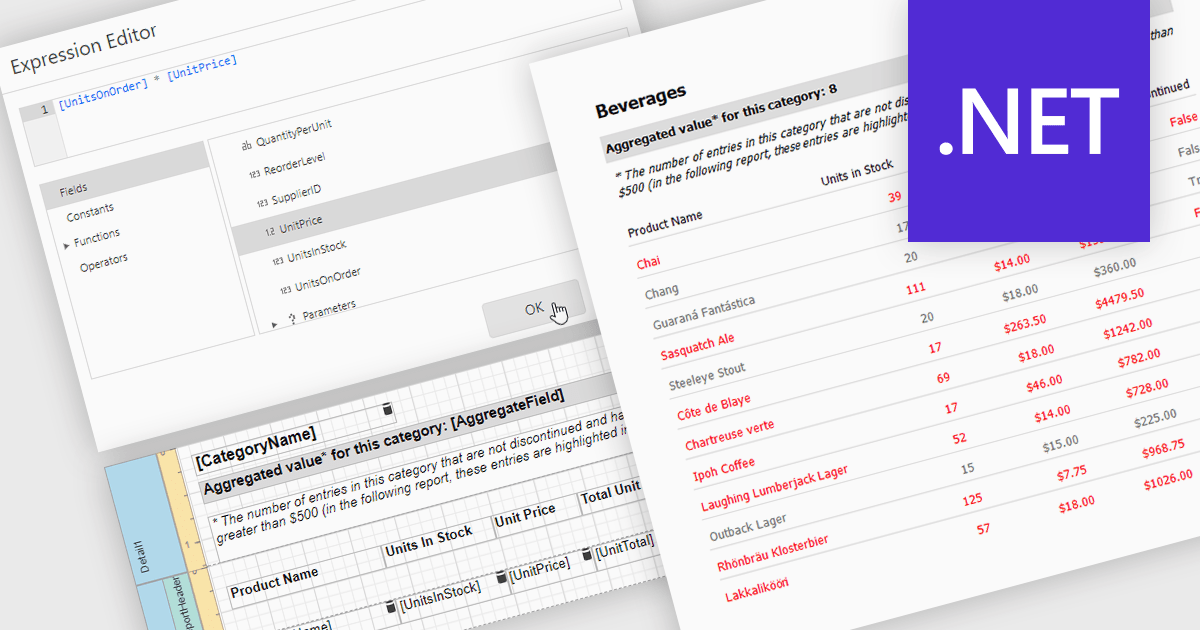
Calculated fields in reports allow you to apply custom expressions to one or more data fields, enabling data to be transformed directly within the reporting environment. This makes it possible to create new metrics such as percentages, ratios, or combined values without changing the underlying data source. As a result, reporting becomes more flexible and efficient, helping users uncover deeper insights and tailor outputs to specific needs. Calculated fields can also be used to group and sort data dynamically, improving how information is organized and presented. Common use cases include calculating profit margins, creating performance indicators, and combining fields to enhance report clarity.
Several .NET reporting controls offer calculated field functionality including:
For an in-depth analysis of features and price, visit our comparison of .NET Reporting controls.
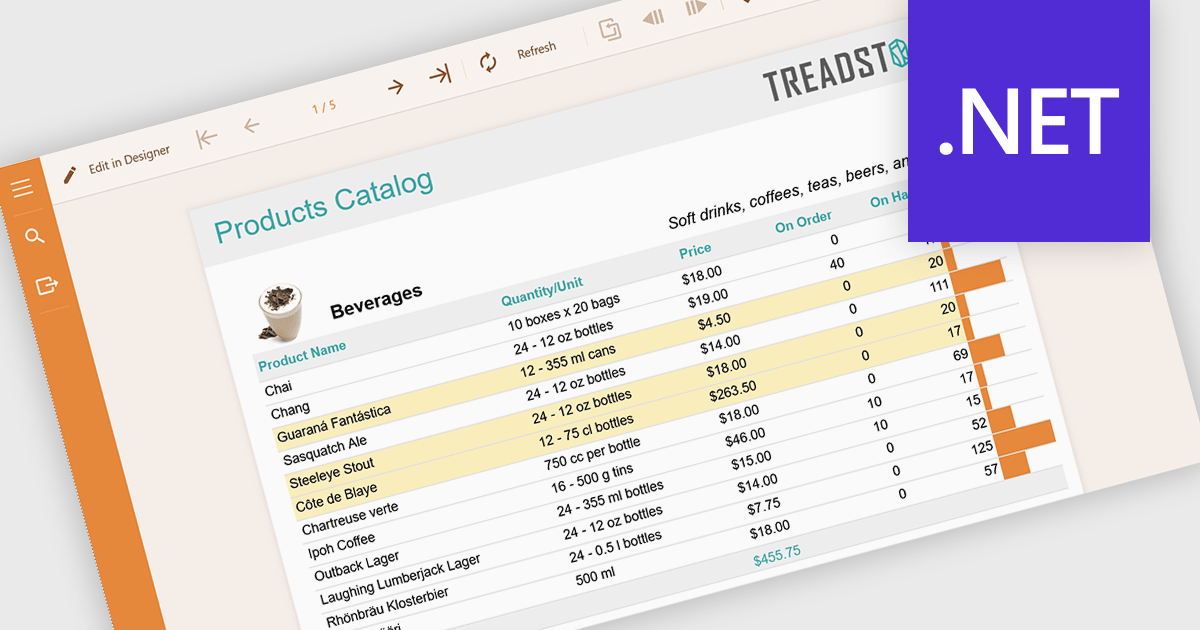
Conditional formatting in reports refers to the automatic application of visual styles such as colours, icons, or data bars based on specific rules or values within the data. This technique enhances reporting by making key information immediately visible, improving readability, and enabling faster, more informed decision making. By dynamically highlighting thresholds, trends, and anomalies, conditional formatting reduces the need for manual analysis while ensuring consistency across reports. Common use cases include flagging underperforming KPIs in financial dashboards, highlighting overdue tasks in project reports, visualising sales performance against targets, and identifying outliers in large datasets. Overall, it transforms static data into intuitive, actionable insights that are easier for users to interpret at a glance.
Several .NET reporting components allow you to apply conditional formatting, including:
For an in-depth analysis of features and price, visit our comparison of .NET reporting components.
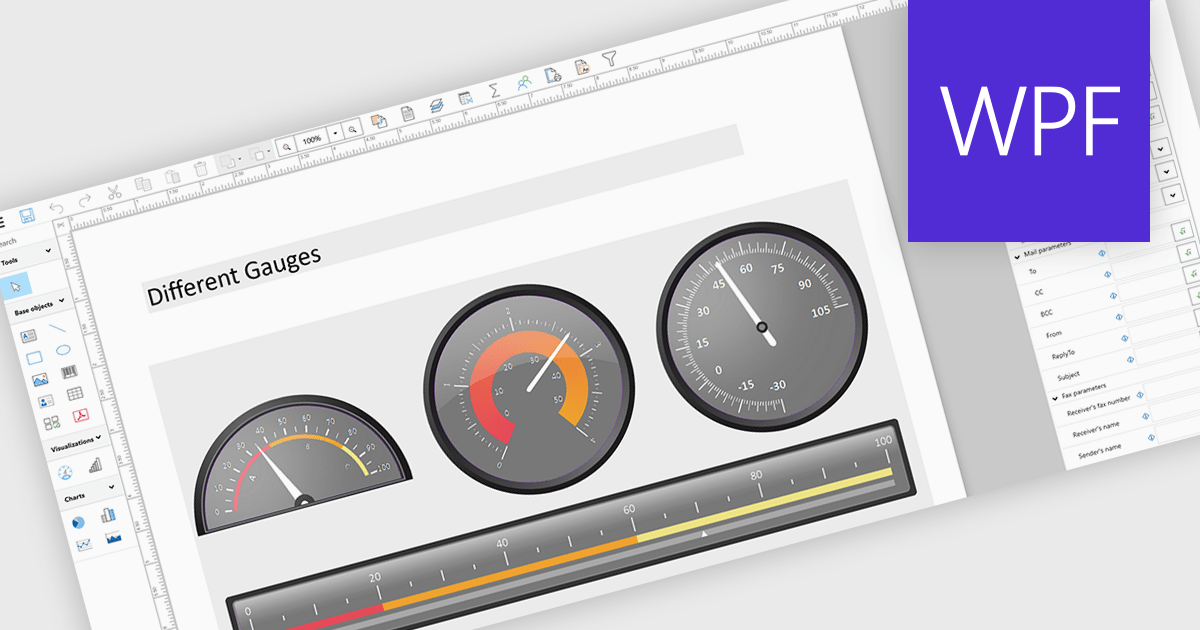
Adding gauges to reports means incorporating visual indicators such as dial or meter style graphics that display key metrics against defined ranges or targets, making performance instantly understandable at a glance. This approach enhances report clarity by transforming complex or dense data into intuitive visuals, helping users quickly assess whether values fall within acceptable, warning, or critical thresholds. As a result, gauges support faster, more informed decision making, improve stakeholder communication, and create more engaging, user friendly reports. Common use cases include tracking sales performance against quotas, monitoring system health or uptime, visualizing budget utilization, and displaying KPI progress in executive dashboards where quick insights are essential.
Several .NET WPF Reporting controls include Gauges including:
For an in-depth analysis of features and price, visit our comparison of .NET WPF Reporting Controls.
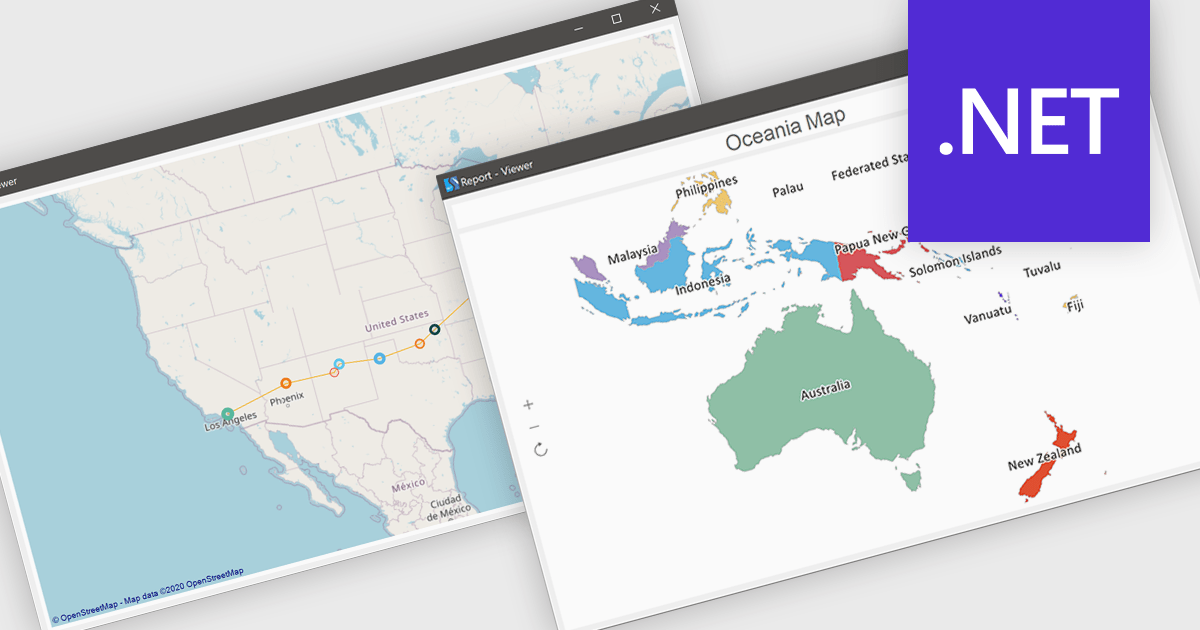
Maps in reports enable data to be visualized geographically, allowing information to be presented in the context of location rather than in traditional tables or charts. By transforming complex datasets into intuitive map-based visuals, this feature makes it easier to identify regional trends, compare performance across territories, and uncover patterns that might otherwise go unnoticed. It enhances data storytelling by providing a clear and engaging way to communicate insights, while also supporting faster, more informed decision-making. Common use cases include analyzing sales performance by region, tracking customer demographics, monitoring delivery logistics, and evaluating market opportunities across different areas.
Several .NET reporting controls offer maps, including:
For an in-depth analysis of features and price, visit our comparison of .NET reporting controls.





Tel.: (888) 850 9911
Fax: +1 770 250 6199


