


Offizieller Lieferant
Als offizieller und autorisierter Distributor beliefern wir Sie mit legitimen Lizenzen direkt von mehr als 200 Softwareherstellern.
Sehen Sie alle unsere Marken.
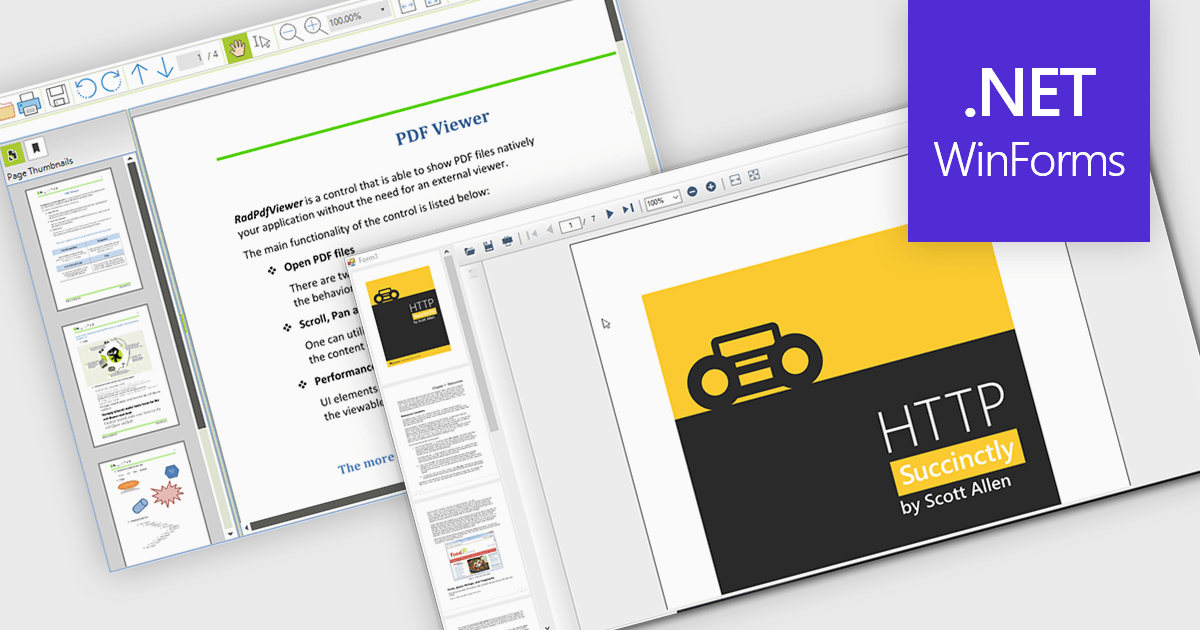
Thumbnail navigation empowers users to navigate PDF documents with greater speed and ease by offering a visual preview of individual pages in a compact thumbnail view. This feature significantly improves the user experience by presenting a clear overview of the document’s structure, allowing users to quickly locate and access specific pages. By minimizing the time and effort needed to find content, especially in lengthy documents, thumbnail navigation enhances productivity and streamlines document interaction.
Several WinForms PDF Viewers feature thumbnail navigation support, including:
For an in-depth analysis of features and price, visit our WinForms PDF Viewer comparison.
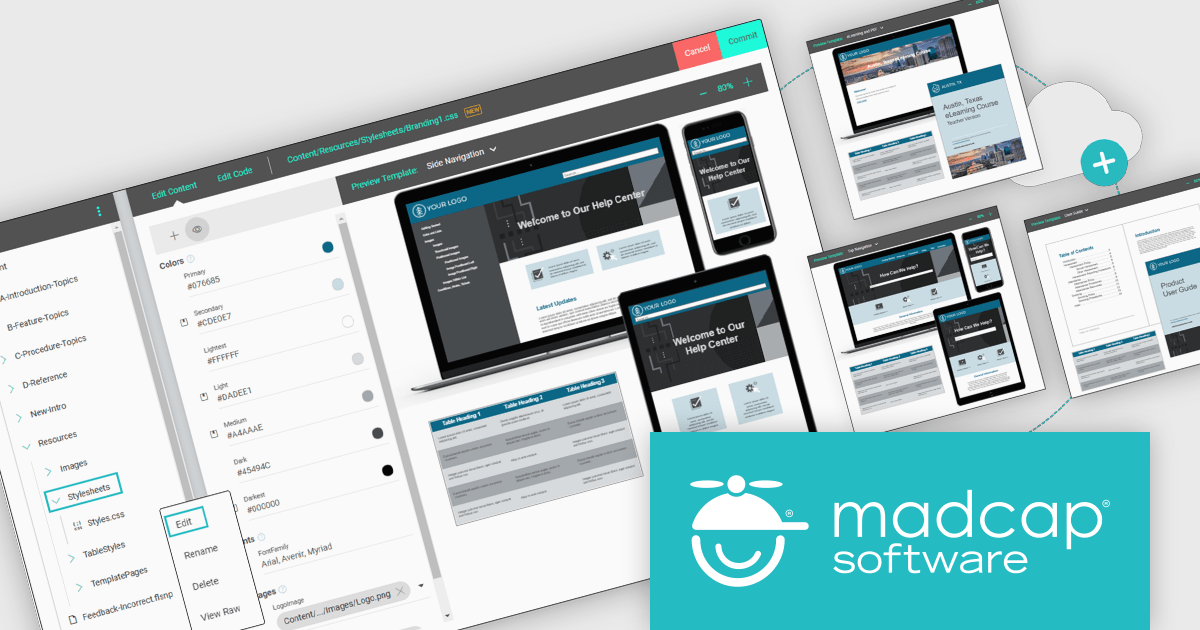
MadCap Central, a cloud-based content experience management (CxM) platform by MadCap Software, offers software developers a centralized hub for managing the entire content development lifecycle. It streamlines tasks like version control, project management, and content collaboration, while also providing functionalities like automated publishing, content hosting, and output analytics. This integrated approach can significantly improve development team efficiency and content accuracy.
The MadCap Central November 2024 update elevates the Branding Editor with live CSS previews and additional customization options, allowing teams to manage and apply consistent branding across all platforms seamlessly. This update enables instant visibility into branding adjustments, reducing errors and ensuring uniformity across large-scale documentation projects. Ideal for organizations prioritizing brand consistency, the new features streamline workflows and improve accuracy, making it easier to uphold brand standards efficiently.
To see a full list of what's new in the November 2024 update, see our release notes.
MadCap Central is licensed per user and is available as an annual license. See our MadCap Central licensing page for full details.
For more information, see our MadCap Central product page.

Microsoft has released .NET 9, the latest version of its popular development platform, featuring a suite of improvements aimed at boosting performance, developer productivity, and cross-platform flexibility. Key highlights include native AOT (Ahead of Time) compilation for faster startup times and reduced memory usage, enhanced container support for streamlined deployment on Docker and Kubernetes, and expanded AI capabilities with updated ML.NET tools and support for ONNX (Open Neural Network Exchange) models. These advancements make .NET 9 a powerful choice for cloud-native, AI-enhanced, and cross-platform applications.
C# 12 is included with new syntax features that simplify coding and reduce boilerplate, while ASP.NET Core and Blazor updates improve web development experiences. Blazor enhancements enable highly interactive web UIs with C#, while ASP.NET Core now offers more efficient middleware and better support for real-time applications. Updates to MAUI (Multi-platform App UI) extend capabilities for cross-platform development, giving developers more tools for creating mobile and desktop applications from a single codebase.
.NET 9 brings new AI capabilities that simplify the integration of machine learning into applications, with updated ML.NET tools and enhanced support for ONNX models, enabling developers to implement image recognition, natural language processing, and predictive analytics more easily. Improved workflows for model training and edge inferencing allow real-time AI processing on local devices, reducing latency. Coupled with the native AOT compilation, these enhancements make AI-driven .NET applications faster and more efficient, opening up streamlined possibilities for intelligent, responsive applications across platforms.
.NET 9 is a powerful upgrade that boosts app performance and deployment flexibility, especially for developers working with cloud, web, and cross-platform applications. Though not a Long Term Support release, it sets the stage for .NET 10, offering early access to features that will shape the framework's future.
View the official Microsoft blog for all the details, including a link to download .NET 9.
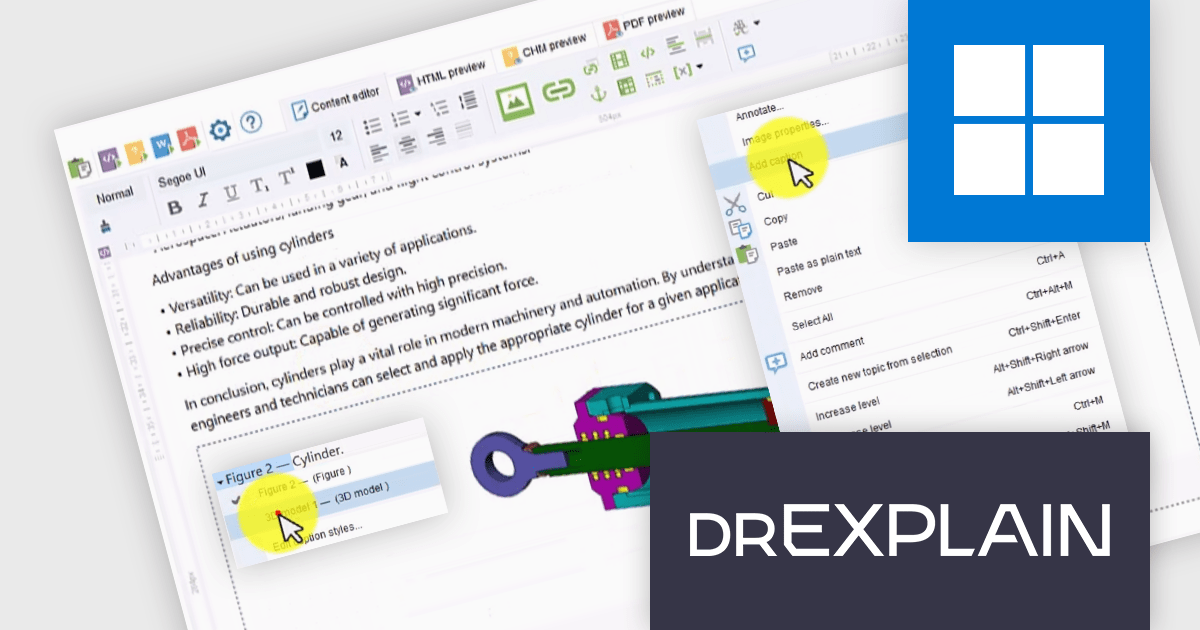
Dr.Explain by Indigo Byte Systems is a sophisticated software documentation tool designed to streamline the creation of detailed help files, user guides, online manuals, and technical documentation. It captures screenshots from a live software application or web site and allows you to directly embed explanations and instructions, reducing the time and effort required to produce high-quality, context-sensitive user guides. With robust features for editing and organizing content, Dr.Explain supports various output formats, including HTML, CHM, RTF, and PDF, ensuring compatibility with different platforms and user needs. This tool enhances productivity by streamlining the documentation process, enabling developers to produce professional and user-friendly documentation efficiently.
The Dr.Explain v6.9.1321 update introduces a new feature enabling you to add image and table captions, with various styles and automatic numbering. This feature makes adding context to visual elements easy, with consistent, structured labeling throughout the documentation, which improves readability and reference efficiency. By automating numbering, the update minimizes manual errors and saves time during content revisions, ensuring that each reference remains accurate as content is adjusted. This enhancement supports developers in producing well-organized, high-quality technical documentation, which in turn aids end-users in navigating complex software environments.
To see a full list of what's new in v6.9.1321, see our release notes.
Dr.Explain is licensed per user-PC schema and is available as an annual license with Premium maintenance and free updates, or as a perpetual license with only Basic maintenance and minor updates. See our Dr.Explain licensing page for full details.
For more information, see our Dr.Explain product page.
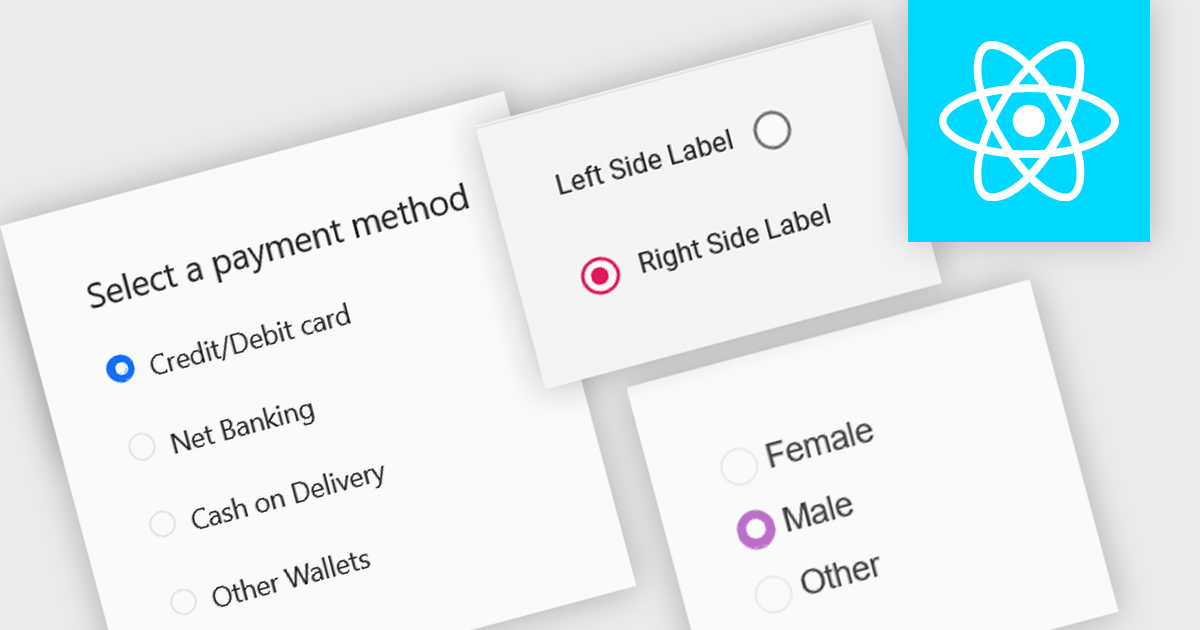
A radio group is a user interface element that presents a set of mutually exclusive options. Users can select only one option from the group at a time, visually represented by a circular button that fills with color when selected. This design pattern is commonly used to represent options like gender, payment method, or difficulty level, where a single choice is required and alternatives are clearly defined. Radio groups enhance user experience by simplifying decision-making, reducing cognitive load, and preventing errors associated with ambiguous selections.
Several React data editor collections feature a radio group, including:
For an in-depth analysis of features and price, visit our React data editors comparison.


Tel.: (888) 850 9911
Fax: +1 770 250 6199


