.netCHARTING 9.1

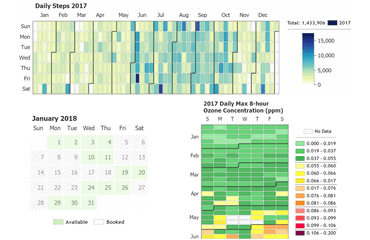
Integriert ein neues Kalender-Heatmap-Diagramm.
September 29, 2018
Neue Version

Funktionen

  • Calendar Heatmap - A brand new chart type for 9.1, the intelligent calendar charts support automatic ranged views, tooltips and date grouping. Now you can add custom date specific data, merge multiple values or bind an event to a date range with ease. Easily highlight dates or date ranged with custom visuals for showing calendar availability, blackout periods, special events and much more.
  • Calendar Views - 18 calendar views that break down time spans from decades to minutes.
  • Label html tag improvements - New label html tag support including hr and img and List support (ul li).
  • Vector Icon support through the icon text tag - The icon tag can now be added to any text label with the full library of icons available including custom svg path support.
  • Box layout system - .netCHARTING version 9.1 introduces a major enhancement to the box layout and positioning system, unifying the legend, annotations, and uiItems into a single layout mechanism with positioning options that arrange the boxes either inside or outside chart area.
  • Client side SmartLabels - Version 9.1 includes an intelligent point labeling system that is capable of handling label collisions and fit issues automatically without obscuring other points and labels.
  • CSV loading client side - The window.fetch() function can be referenced through JSC.fetch() and is also supported in IE11 through a polyfill. The JSC.parseCsv(text) function splits CSV text into rows and columns, detects and separates header rows, and parses values into string or numeric values automatically.
Calendar Heatmap chart

.netCHARTING

Nutzen Sie die Möglichkeit für das schnelle und einfach Anzeigen großer Mengen dynamisch generierter Diagrammdaten.

Sie haben eine Frage?

Live-Chat mit unseren .netCHARTING-Lizenzierungs-Spezialisten.