Stimulsoft Reports.Wpf 2019.2.1

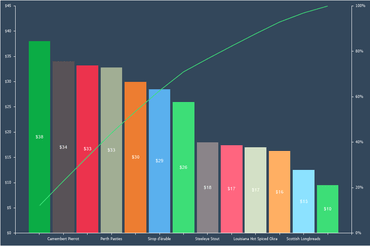
Fügen Sie Ihren Berichten Pareto-Diagramme hinzu.
Februar 15, 2019
Neue Version

Funktionen

  • Pareto Chart - When designing reports, you now have the ability to create Pareto charts. This type of chart contains both bars and a line graph, where individual values are represented in descending order by bars, and the cumulative total is represented by the line.
  • Abbreviations in formatting - You can now use abbreviated numbers with numeric and currency formatting in reports or dashboards. For example, for thousands of values you may use the abbreviation K, for millionths M, for billionths B. To enable the use of abbreviations of values, set the checkbox next to Use Abbreviation in the format editor.
  • Export to JSON - To convert the report, click Save in the report viewer, select the item Data File... and select JSON as the file type. You can export a whole report or data only or data with header and footers.
Pareto Chart

Stimulsoft Reports.WPF

Integrieren Sie das Reporting in Ihre WPF-Anwendungen.

Sie haben eine Frage?

Live-Chat mit unseren Stimulsoft-Lizenzierungs-Spezialisten.