AnyChart 8.6.0

Integriert eine Timeline Chart- und Network Graph-Funktion.
Mai 15, 2019
Neue Version

Funktionen

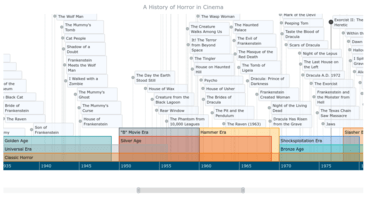
  • Timeline Chart - A timeline is a display of a list of events in chronological order. It is typically a graphic design showing a long bar labeled with dates paralleling it, and usually contemporaneous events.
  • Network Graph - Network graph is a mathematical structure (graph) to show relations between points. The graph visualizes how entities are interconnected with each other. Entities are displayed as nodes (points) and the relationship between them (edges) are displayed with lines.
  • Improvements
    • AnyChart Locales Improved.
    • Custom Messages in locales.
    • Color Scale reworked - default range and "equal" flag are added.
    • Auto localized context menu from the included locale.
Timeline Chart

AnyChart JS

JavaScript-Diagramme zur Einbettung und Integration.

Sie haben eine Frage?

Live-Chat mit unseren AnyChart-Lizenzierungs-Spezialisten.