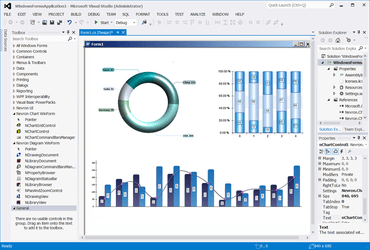
Nevron Chart for .NET 2019.1

Integriert die Unterstützung für Microsoft Visual Studio 2019.
Mai 17, 2019
Neue Version

Funktionen

  • Support for Visual Studio 2019
    • Complete integration with VS2019 for the WinForm, WPF and WebForms chart controls. In addition, it fixes problems with http hanlders registration during design time in all versions of Visual Studio.
  • Bubble Series Improvements
    • Added support for non-normalized bubble min max sizes. This allows to display bubbles with smaller data size as larger on bubbles on the screen and vice versa.
  • Heat Map Series Improvements
    • Added property InterpolateImageEdges to control the way heat maps scale to the edge. Improved heat map contour generation.
  • Grid Surface Improvements
    • Added support for conversion of triangulated to grid data (binning) using the grid surface data InitFromPoints method.
  • Pie Series Improvements
    • Added property for showing the label connectors begin cap - ShowLabelConnectorBeginCap property;
    • Added property for centering the pie series when in spider non overlap move - CenterPie property.
  • Various Stability and Performance Improvements
    • The new version features fixes to all reported problems as well small performance improvements in the control.
Nevron Chart for .NET

Nevron Chart for .NET

Bieten Sie vielseitige Diagrammfunktionen in Ihren WinForms- und ASP.NET-Anwendungen.

Sie haben eine Frage?

Live-Chat mit unseren Nevron-Lizenzierungs-Spezialisten.