JSCharting 3.1

Integriert eine automatische Spaltenrundung, Punktradiussteuerung und Beschriftungsdeckkraft.
August 13, 2021
Neue Version

Funktionen

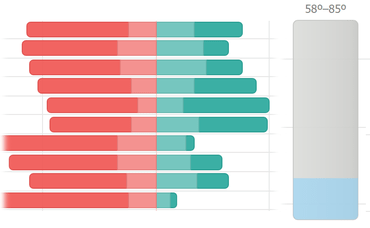
  • Automatic Column Rounding - JSCharting will apply corner rounding to columns and bars at the appropriate edges automatically. A visually pleasing corner radius is also automatically calculated to soften the column look regardless of size while being subtle enough not to interfere with reading specific chart values.
  • Point Radius - You can use the Point.radius property to disable corner rounding by setting a value of 0, or manually set a value to control the corner rounding to match the exact look you require.
  • Full Radius Rounding - Setting Point.radius to 100 will provide a fully round bar or column offering a fresh minimal look for your data visualization.
  • Label Opacity - Control label opacity conveniently by setting the Label.opacity property.
  • Overlapped Axis Ticks - A new axis.defaultHiddenTick property is now available to control ticks that are overlapped. You can now force them to appear regardless of overlap, or hide them completely by setting the defaultHiddenTick.label.opacity property.
  • Added support for Numeric Point Shorthand - Set point values using a simple array of numbers such as `series.0.points=[1,2,3]`.
  • Legend Line Icons - Legend line icons have been enhanced with the addition of dash styles and you can represent line series of varying widths and dash styles more accurately by scaling both attributes on the legend icon.
  • 26 new samples - 26 new samples have been added demonstrating a wide range of chart features and functionality that you can use as a starting point to chart you data.
Automatic column rounding

JSCharting

Atemberaubende JavaScript-Diagramme und Datenvisualisierungen für Ihre Website und Internetanwendungen.

Sie haben eine Frage?

Live-Chat mit unseren JSCharting-Lizenzierungs-Spezialisten.