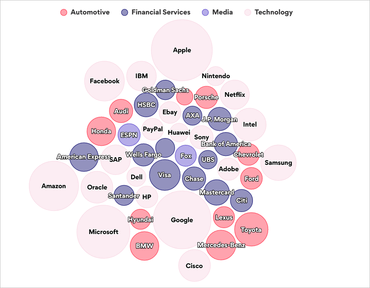
Integriert ein neues komprimiertes Blasendiagramm zum Visualisieren hierarchischer Daten als verschachtelte Kreise.
Juni 7, 2022
Neue Version
Funktionen
Added new Packed Bubble chart.
Packed Bubble, also known as Circular Tree Map or Circle Packing, is great for visualizing hierarchical data as nested circles of different sizes and colors.
Each circle represents a level in the data hierarchy, with the color of the circle corresponding to an attribute and the size determined by a metric value.
With Packed Bubble charts, readers can quickly and easily spot patterns even when using large datasets.