Syncfusion Essential Studio for .NET MAUI 2023 Volume 1

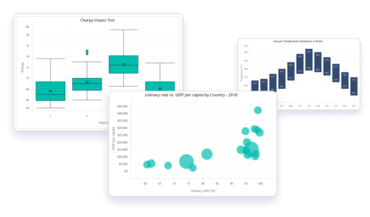
Integriert sechs neue Diagrammtypen, darunter Bereichsspalten, Blasen, gestapelte Spalten, Wasserfall, Box & Whisker und Fehlerbalken.
März 27, 2023
Neue Version

Funktionen

  • The following controls are now marked as production-ready:
    • Autocomplete.
    • Backdrop Page.
    • Calendar.
    • ComboBox.
    • DataForm.
    • Funnel Chart.
    • Maps.
    • Pyramid Chart.
    • Rating.
    • Signature Pad.
    • Text Input Layout.
  • Masked Entry (New)
    • An advanced version of the input control that restricts the input of certain characters by using a mask.
      • Easily mask input values.
      • Use simple or regex masking types with either a fixed or variable length.
      • Format input values with prompts, literals or both.
      • Customize the prompt characters to use them as input in the absence of user input.
  • Popup (New)
    • An alert dialog that displays content in a separate window on top of the current screen.
      • Position: Display a popup at any desired location on screen.
      • Relative to view: Display a popup in positions relative to any control on the screen.
      • Full-screen mode: Display a popup with full-screen width and height to show large content.
      • Auto size: Automatically adjust the popup's width and height based on the content loaded in it.
      • Different layouts: Choose from default layouts, such as one-button layout and two-button layout, to display simple, minimal information.
      • Template support: Load any view as the header, footer, and content through a template.
      • Modal mode: Make the popup a modal dialog to prevent interactions with the underlying screen until certain actions are performed.
  • Shimmer (New)
    • A tool for enhancing an application's responsiveness while loading data in the background by showing modern shimmer effects.
      • Easy integration.
      • Seven built-in shimmer types.
      • Custom shimmer types are supported.
      • Shimmer wave effects can come from multiple directions.
      • Customizable built-in views with various options such as fill, wave width, repeat count, animation duration and wave color.
  • AutoComplete
    • Now allows users to customize drop-down items using custom templates.
  • Barcode generator
    • The .NET MAUI Barcode Generator can now be exported to image formats like JPEG and PNG.
  • Calendar
    • The month view can now support the display of icons such as dots, hearts, diamonds, stars and bells if special dates are specified. The icon colors are also customizable.
    • Added the ability to confirm or deny the selected date, dates, or date ranges.
    • You can now customize the month, year, decade, and century cells with a personalized data template.
  • Cartesian Charts
    • New chart types:
      • Range column chart - Range column chart allows you to visualize data points with range columns, making it easy to identify patterns and trends, as well as compare different data sets.
      • Bubble chart - Bubble chart is a visually appealing way to represent data with multiple dimensions, as the size of the bubbles indicates an additional data dimension.
      • Stacked column chart - Stacked column chart is composed of multiple column series that are placed on top of one another. The height of each column is determined by the value of the data point it represents, allowing for a way to display the cumulative value of data points and making it easy to identify patterns and trends in the data.
      • Waterfall chart - Waterfall chart visually represents the cumulative effect of a set of positive and negative values. The chart is displayed as rectangles with connectors between each one, making it easy to understand the impact of each value on the overall total.
      • Box and whisker chart - Box and whisker chart provides a standardized and concise way of displaying the distribution of data and identifying outliers. This allows users to represent data as a box plot, which highlights the minimum, first quartile, median, third quartile, and maximum of a data set.
      • Error bar chart - Error bars are used to indicate errors or uncertainties in reported values, allowing for the discovery of potential measurement deviations.
    • Export support - The .NET MAUI Cartesian charts can now be exported to image formats like JPEG and PNG.
  • Circular Charts
    • Radial bar chart - Radial bars are visually appealing and an effective way to show comparisons between categories using circular shapes.
    • Export support - The .NET MAUI Circular charts can now be exported to image formats like JPEG and PNG.
  • ComboBox
    • The ComboBox control now allows users to customize drop-down items using custom templates.
  • DataForm
    • The DataForm now supports a floating label layout, which displays a label floating above an input editor, such as an entry or combo box, as the user types or interacts with it.
  • DataGrid
    • You can now group columns under a common header. Users can add multiple rows and define multi-column headers in the stacked header rows.
    • Users can now display a row containing summary data for the columns at the top or bottom of the grid.
    • Users can now freeze certain rows or columns, so that they remain visible when the rest of the grid is scrolled.
    • Added support for scrolling to a specific row, column, or cell in the DataGrid. Users can define whether or not to animate the scroll programmatically.
  • Microsoft Excel Library
    • Slicer support for Excel tables - Users can now programmatically create slicers for Excel tables to filter table data in Excel files.
    • Excel-to-PDF conversion enhancements:
      • Preserves gradient fill for cells and shapes.
      • Preserves cell formats that are applied through date-occurring conditional formatting.
  • Funnel Charts
    • The .NET MAUI Funnel charts can now be exported to image formats like JPEG and PNG.
  • Maps
    • Panning event support - The panning event is triggered when the user moves their finger or the pointer on the map, allowing for the retrieval of the corresponding screen coordinates. Additionally, this event supports identifying whether the panning has started or been completed.
    • Tapped event support - The tapped event is triggered when the user taps on the map, allowing for the retrieval of the corresponding screen coordinates.
    • You can now use the get latitude and longitude from the point method to convert screen coordinates to their corresponding map latitude and longitude values.
  • PDF Library
    • TIFF to PDF converter - The Syncfusion .NET MAUI PDF Library now supports the conversion of TIFF images to PDF documents. This feature supports both single and multi-frame TIFF images.
  • PDF Viewer (Preview)
    • Text search - You can now search for the desired text and navigate to all its occurrences in a PDF document.
    • Outline view - Added an outline view that displays a document's hierarchical list of headings and subheadings. It also allows users to navigate through the different parts of a document.
    • Document link navigation - You can now navigate to the desired topic or position through document link annotations (a table of contents) in a PDF document.
    • Hyperlink navigation - You can now open URLs or website links in a PDF document in the default browser.
    • Right to left (RTL) - You can now change the user interface to display from right to left.
    • Localization - All static text within the PDF Viewer can now be localized to any supported language.
  • Pyramid Charts
    • The .NET MAUI Pyramid charts can now be exported to image formats like JPEG and PNG.
  • Microsoft Word Library
    • The Syncfusion .Word Library can convert Markdown files to Word documents. You can also load images based on the image source path while converting.
    • Now supports finding Word document elements based on specified properties and their corresponding values. For example, with this new functionality, you can find:
      • An image with an alternative text (Alt text) value as "logo".
      • The content control with type "plain text" and "first name" as the title.
      • Block content controls with "address" as the title.
      • Charts with type "pie" and "analysis report" as the title.
New chart types

Syncfusion Essential Studio .NET MAUI

.NET MAUI-Steuerelemente zum Erstellen plattformübergreifender mobiler und Desktop-Apps mit C# und XAML.

Sie haben eine Frage?

Live-Chat mit unseren Syncfusion-Lizenzierungs-Spezialisten.