Über MindFusion.Charting for Xamarin

Eine Xamarin Forms-Komponente für Armaturenbretter, 2D- und 3D-Diagramme.

MindFusion.Charting for Xamarin provides applications with charting capabilities. From a rich set of chart types to multiple data options and styling settings - all the features you need to add a great chart to your platform-independent software are gathered in a single component.

MindFusion.Charting for Xamarin Features

  • A Rich Set of Chart Types - The Xamarin charting component offers numerous options to choose from. Whether you opt for 2D or 3D charts, you have a variety of chart formats available - bars and area, scatter and line, bubble and pie, radars or financial charts. Each chart type exposes many properties, which you can use to customize it even further until it perfectly suits the need of your users.
  • Flexible Chart Structure - The library does not expose strict rules on the structure of a chart. Instead, you have the freedom to use any from the various available building blocks - images, labels, legends, axes, grid layout - to create the unique chart that fully answers the requirements of your project. That's a valuable option for software that might run on small screens and needs to rearrange its looks according to the available space.
  • Data - MindFusion Xamarin chart library can read its data from any data source, as long as it implements the Series interface. Of course, a full set of predefined data binding options to all common data sources are available out of the box - XML, numeric lists, DB fields, DateTime values etc.
  • Stylish Charts - Customizing the appearance of a chart is done on several levels. You have the option to style basic elements like the background of a label or you can create a global theme applicable to any chart you build, which you can serialize and reuse whenever necessary.
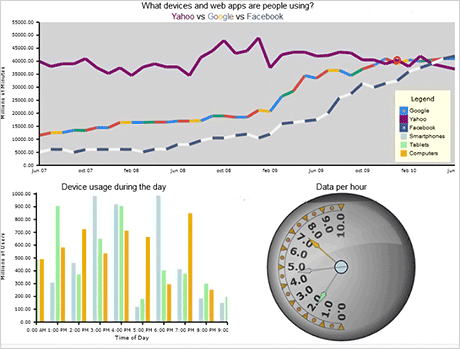
  • Dashboards - Create dashboards that combine various chart types with labels, images and text. The smart layout system dynamically arranges the dashboard components in a way that makes the most of the available space. Decorate the dashboard elements with borders to increase readably. Add legends whenever you need to clarify chart data and place them wherever you find most appropriate.