








Fournisseur officiel
Comme nous somme les distributeurs officiels et autorisés, nous vous fournissons des licences légitimes directement à partir de 200+ éditeurs de logiciels.
Voyez toutes nos marques.
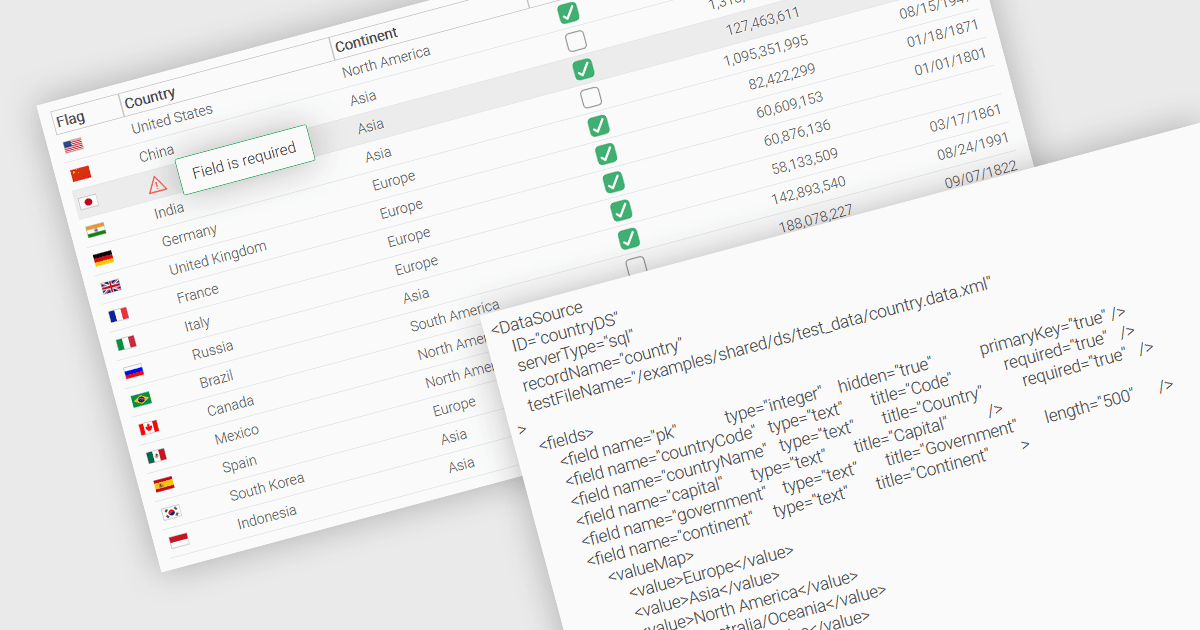
A fundamental feature in a data grid is the ability to specify that a column must be populated with values and cannot be left empty. By designating certain columns as mandatory, developers can enforce input rules that prevent users from leaving critical fields blank, such as user identifiers, product names, or timestamps. Required columns are typically enforced through validation rules that prevent the submission or processing of incomplete records, thereby ensuring the completeness and validity of data entries. This improves data integrity, reduces the likelihood of processing errors, and supports consistent business logic across applications that rely on structured datasets.
Several JavaScript grid controls allow you to set columns as required, including:
For an in-depth analysis of features and price, visit our comparison of JavaScript grid controls.
Stimulsoft Dashboards.JS is a JavaScript-based tool for creating interactive dashboards within web applications. Designed for developers and businesses, it provides customizable charts, graphs, and tables to visualize complex data from various sources. It supports popular JavaScript frameworks such as React, Vue.js, and Node.js, enabling seamless integration into modern web projects. With an intuitive interface and responsive design, it suits use cases like business intelligence, performance monitoring, and data-driven decision-making. Stimulsoft Dashboards.JS enhances user engagement and simplifies data analysis for industries such as finance, marketing, and logistics.
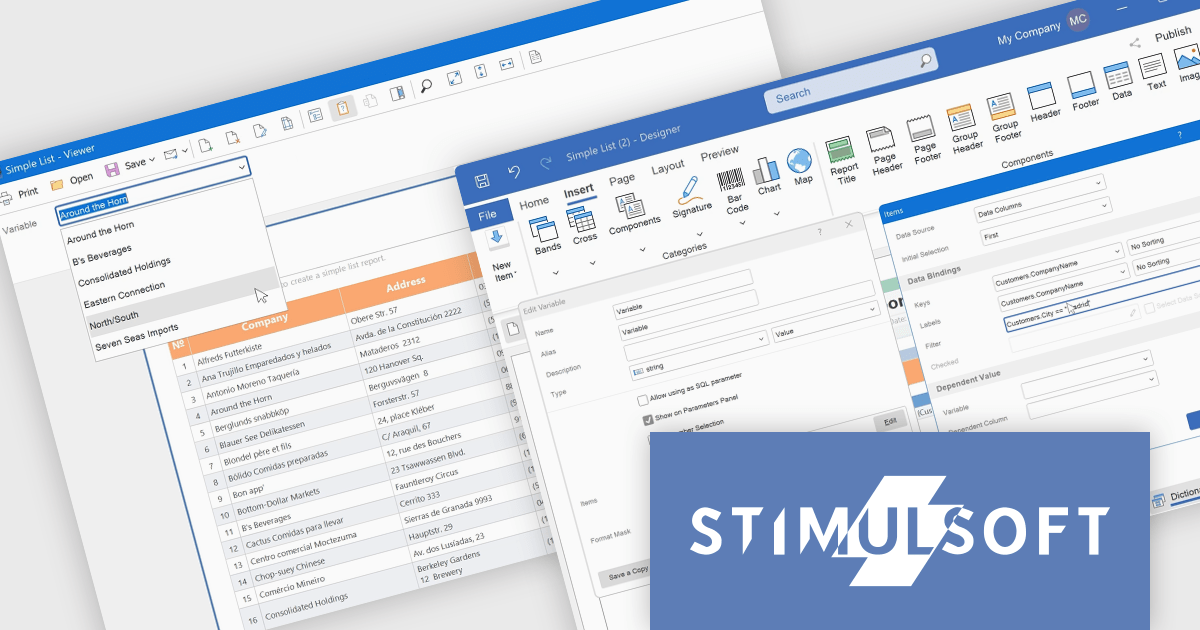
Stimulsoft Dashboards.JS includes the capability to filter variable values within the parameters panel of the viewer. This enhancement allows developers to provide end-users with a more refined and efficient parameter selection experience. By implementing expression-based filtering in the variable editor or Items window, only relevant data options are presented during report or dashboard viewing. This targeted presentation of variable values reduces visual clutter and improves the process of specifying report parameters, ultimately leading to improved usability and more focused data exploration for the end-user.
Stimulsoft Dashboards.JS is licensed per developer and is available as a Perpetual license with 1 year support and maintenance. See our Stimulsoft Dashboards.JS licensing page for full details.
Stimulsoft Dashboards.JS is available individually or as part of Stimulsoft Ultimate.
Highcharts is a JavaScript charting framework that allows web developers and data analysts to generate dynamic, visually appealing charts and graphs for websites and web applications. It can display a variety of chart types, including line, spline, area, column, bar, pie, scatter, and many more. Highcharts is well-known for its ease of use, rich documentation, and ability to handle huge datasets efficiently. Features include responsive design, accessibility support, and cross-browser compatibility. Its customization capabilities allow users to create bespoke data visualizations that increase engagement and provide insightful data presentations.
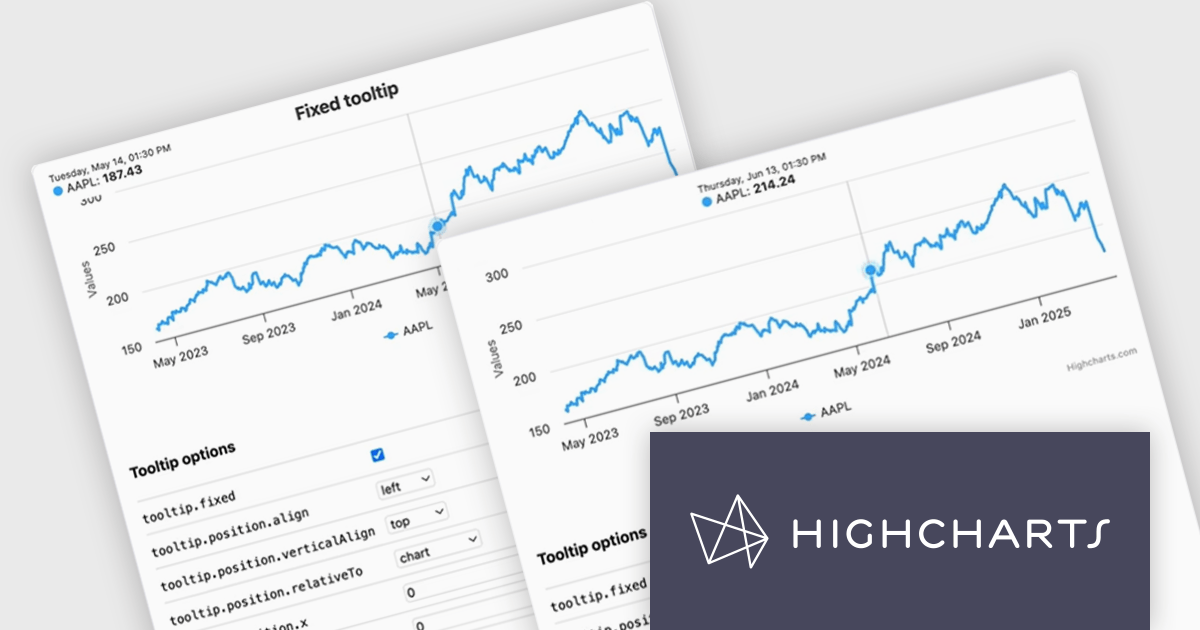
The Highcharts v12.2.0 release introduces a new Tooltip Positioning capability that lets you control tooltip placement directly through configuration, without writing any custom JavaScript. With the new tooltip.fixed and tooltip.position options, you can easily set fixed positions for tooltips and define exactly where they should appear on the chart. This enhancement simplifies layout management, reduces implementation time, and ensures a cleaner, more consistent user experience across your data visualizations.
To see a full list of what's new in v12.2.0, see our release notes.
Highcharts Core is licensed on an annual or perpetual basis, OEM licenses, and Advantage Renewals. It is licensed per Developer and has several license options including Internal, SaaS, SaaS+, and Self Hosted. See our Highcharts Core licensing page for full details.
Learn more on our Highcharts Core product page.
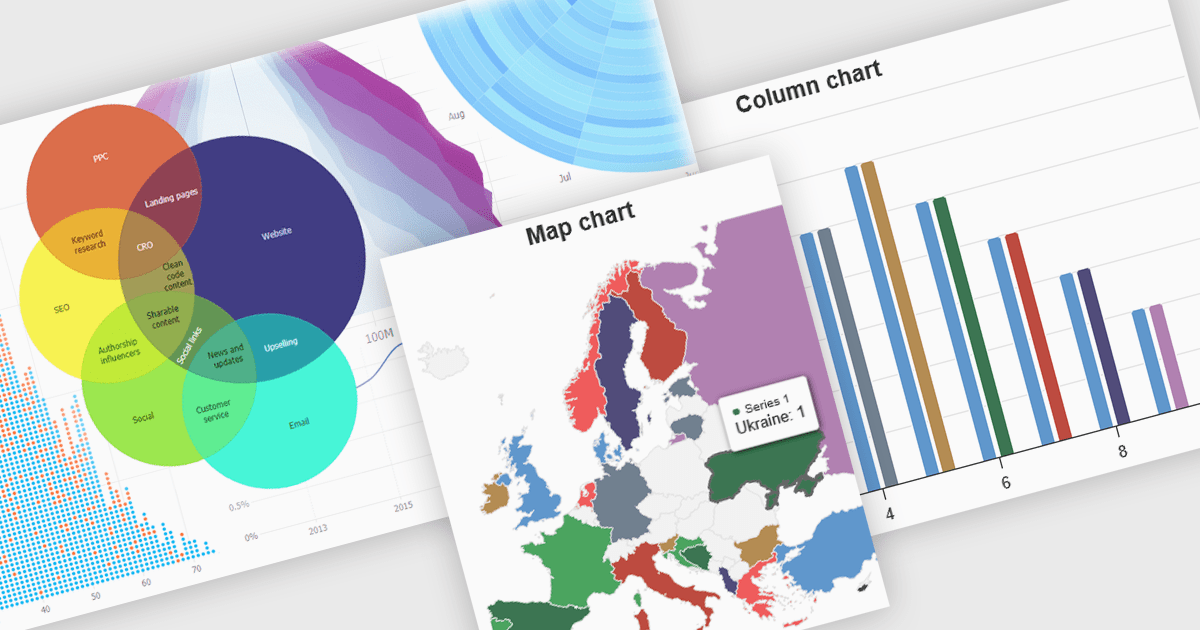
High contrast charts use distinct and contrasting color palettes within data visualizations to improve clarity, particularly for individuals with visual impairments. This involves choosing colors with noticeably different hues and brightness for elements such as lines, bars, labels, and backgrounds, so that differences in data are easy to spot. These charts improve data understanding, make information accessible to more people, reduce eye strain for some users, and support accessibility standards. They are useful in many areas, such as financial reports, scientific papers and public health dashboards that must be clear and designed for a everyone regardless of visual ability.
Several JavaScript charting components provide accessible high contrast features, including:
For an in-depth analysis of features and price, visit our JavaScript chart components comparison.
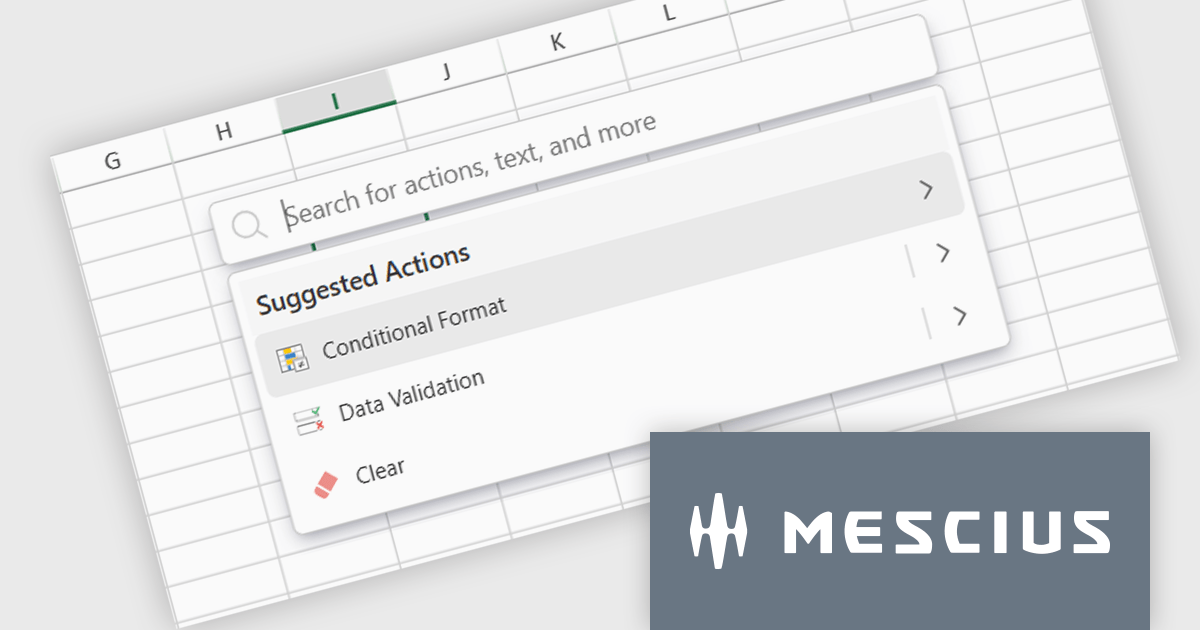
SpreadJS is a high-performance JavaScript spreadsheet and data presentation component designed for enterprise web applications. It enables developers to deliver Excel-like functionality directly within their web solutions, providing advanced features such as data binding, complex calculations, pivot tables, charts, and extensive formatting options. Fully compatible with modern JavaScript frameworks like React, Angular, and Vue, SpreadJS allows seamless integration and customization, empowering development teams to create interactive, data-driven user experiences without relying on external spreadsheet applications.
The SpreadJS 18.1.0 update introduces the new Command Palette, providing developers with a centralized interface to quickly access and execute a wide range of spreadsheet commands without navigating through complex menus. This enhancement improves productivity by reducing the time required to locate functions, allowing developers to apply formatting, manage data, and configure worksheet settings directly through intuitive search and selection capabilities. The Command Palette can be instantly triggered using the familiar Ctrl/Cmd + P keyboard shortcuts, offering quick access to commands and further accelerating common development and data manipulation tasks within the application.
To see a full list of what's new in 18.1.0, see our release notes.
SpreadJS is licensed per developer and includes 1 Year Maintenance (major and minor version releases and unlimited support phone calls). SpreadJS requires an Annual or Perpetual Deployment License. The optional Add-ons are available at an additional cost, and require a SpreadJS license. See our SpreadJS licensing page for full details.
For more information, visit our SpreadJS product page.





Tél : (888) 850 9911
Fax : +1 770 250 6199


