


Fournisseur officiel
Comme nous somme les distributeurs officiels et autorisés, nous vous fournissons des licences légitimes directement à partir de 200+ éditeurs de logiciels.
Voyez toutes nos marques.
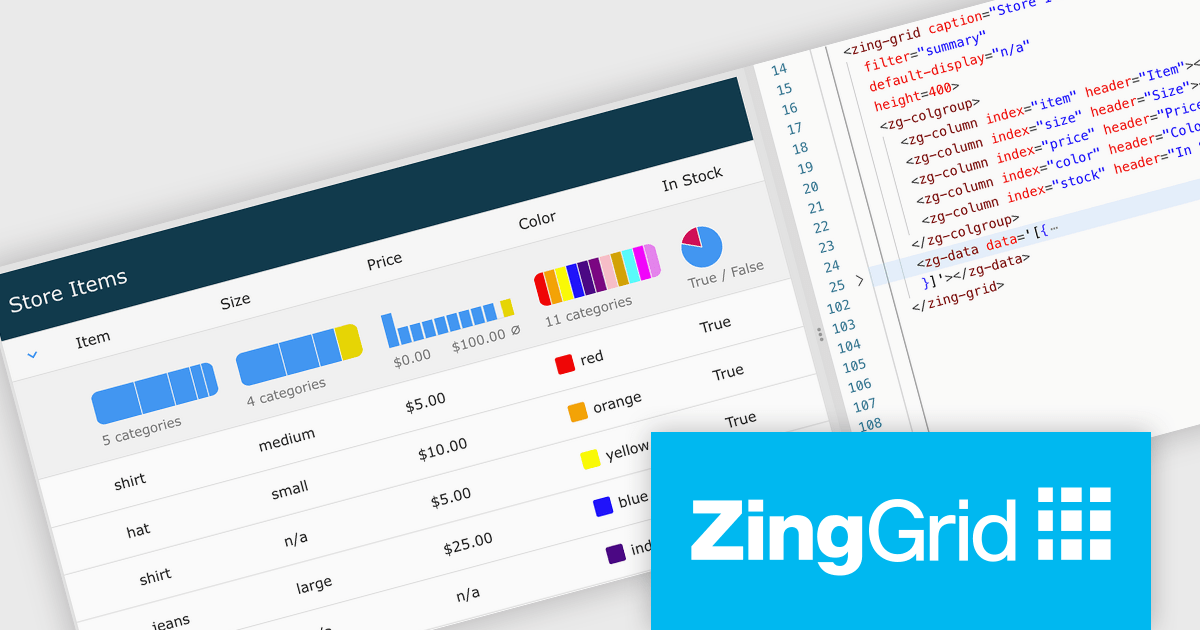
ZingGrid is a JavaScript library that simplifies the creation of interactive data tables and grids within web applications. Utilizing modern web components and focusing on performance and responsiveness, ZingGrid allows developers to implement features like searching, filtering, pagination, and in-line editing with minimal coding. This empowers efficient data visualization and manipulation for users, making it a valuable tool for web development.
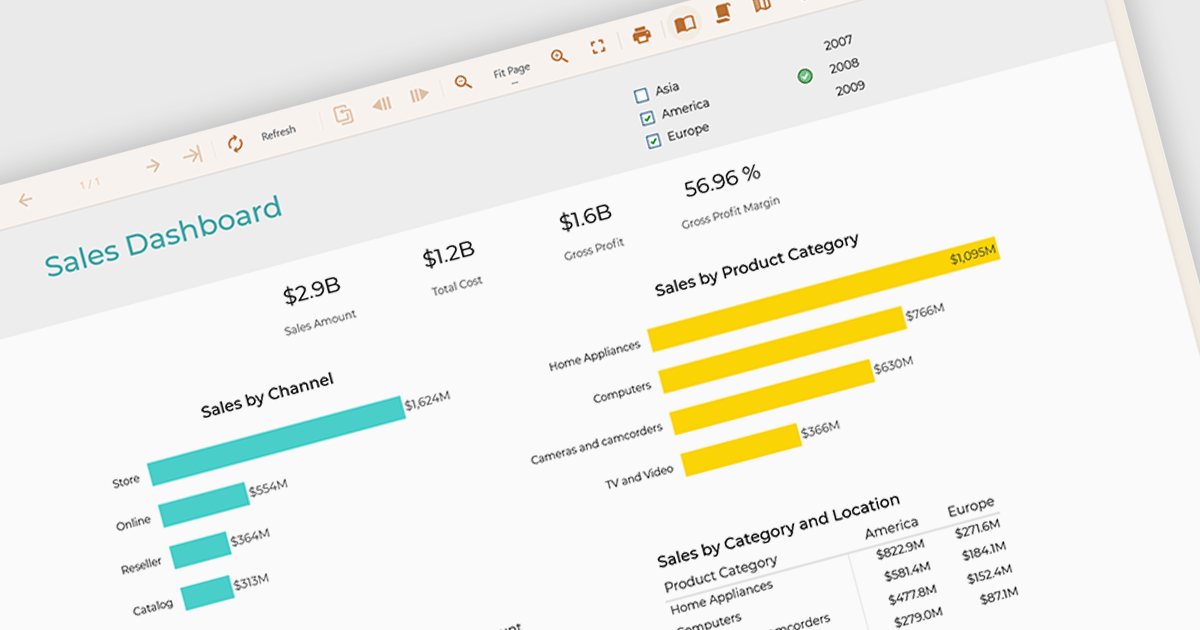
The ZingGrid 2.2.0 update introduces a Filter Summary Chart that enables users to visually explore and filter data through an interactive chart interface, making it easier to identify patterns, trends, and distributions within large datasets. By combining data visualization with filtering functionality, the feature helps users refine results more intuitively and efficiently than traditional filter controls, while allowing developers to quickly add this capability at either the grid or column level with minimal configuration.
To see a full list of what's new in version 2.2.0, see our release notes.
ZingGrid is available as either a Single-Domain Website or Multi-Domain SaaS license. See our ZingGrid licensing page for full details.
For more information, visit our ZingGrid product page.
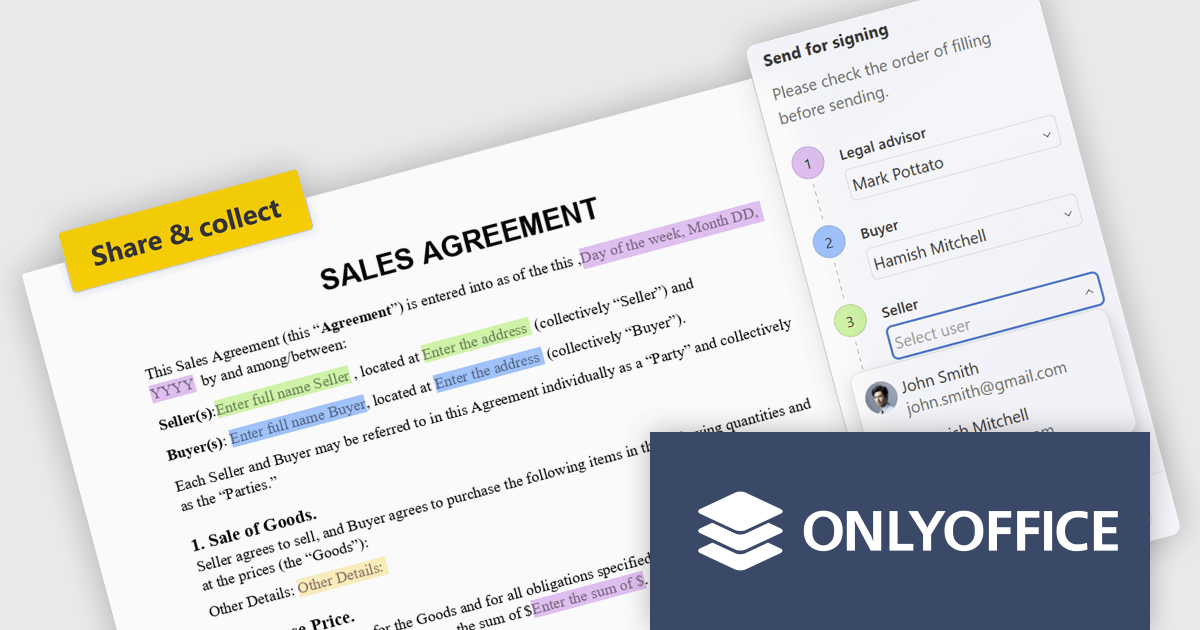
ONLYOFFICE Docs is a comprehensive online editor, allowing users to create text documents, spreadsheets, presentations, and forms. It enables your users to edit, share, and collaborate on documents online in their preferred browser, within your own application. It is fully compatible with OOXML (Office Open XML) formats and supports popular Microsoft Office and other document formats such as CSV, DOC, DOCX, EPUB, HTML, ODP, ODS, ODT, PDF, PPT, PPTX, RTF, TXT, XLS, and XLSX.
The ONLYOFFICE Docs 9.4 update introduces built in recipient assignment and filling status tracking directly within the editor, allowing developers and teams to manage form workflows more efficiently without relying on separate tools or administrative steps. By centralizing recipient management and completion monitoring in a single interface, the feature provides greater visibility into form progress, reduces context switching, and simplifies workflow coordination. This helps improve document driven processes, improves productivity, and enables faster tracking and follow up of outstanding form actions.
To see a full list of what's new in v9.4, see our release notes.
ONLYOFFICE Docs Developer Edition is licensed by the number of simultaneous document connections and is available as an annual license with 1 year support and upgrades. See our ONLYOFFICE Docs Developer Edition licensing page for full details.
For more information, see our ONLYOFFICE Docs Developer Edition product page.
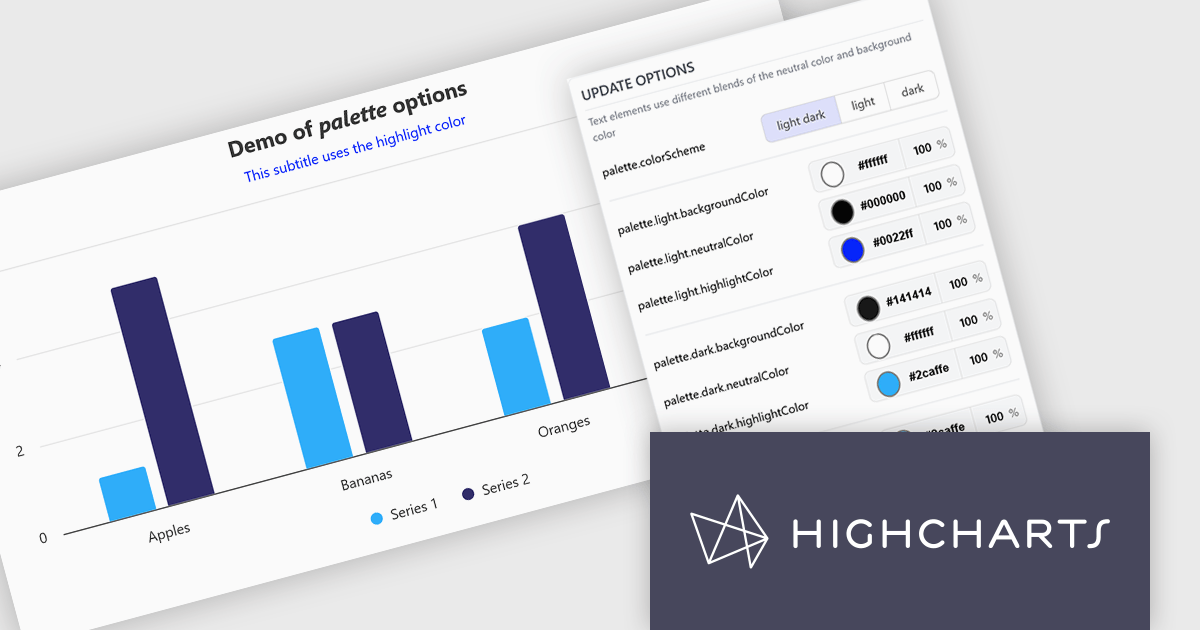
Highcharts is a JavaScript charting framework that allows web developers and data analysts to generate dynamic, visually appealing charts and graphs for websites and web applications. It can display a variety of chart types, including line, spline, area, column, bar, pie, scatter, and many more. Highcharts is well-known for its ease of use, rich documentation, and ability to handle huge datasets efficiently. Features include responsive design, accessibility support, and cross-browser compatibility. Its customization capabilities allow users to create bespoke data visualizations that increase engagement and provide insightful data presentations.
The Highcharts v13 update introduces a centralized color palette system that enables developers to define and manage chart colors, light and dark mode variations, and UI styling from a single configuration. By consolidating color settings across series, chart elements, and interactive states, it reduces repetitive configuration, simplifies brand consistency, and makes large chart collections easier to maintain. The addition of color scheme support and CSS variable exposure also allows charts to adapt more seamlessly to application themes and user preferences while providing greater flexibility for custom styling.
To see a full list of what's new in v13, see our release notes.
Highcharts Core is licensed on an annual or perpetual basis, OEM licenses, and Advantage Renewals. It is licensed per Developer and has several license options including Internal, SaaS, and Self Hosted. See our Highcharts Core licensing page for full details.
Learn more on our Highcharts Core product page.
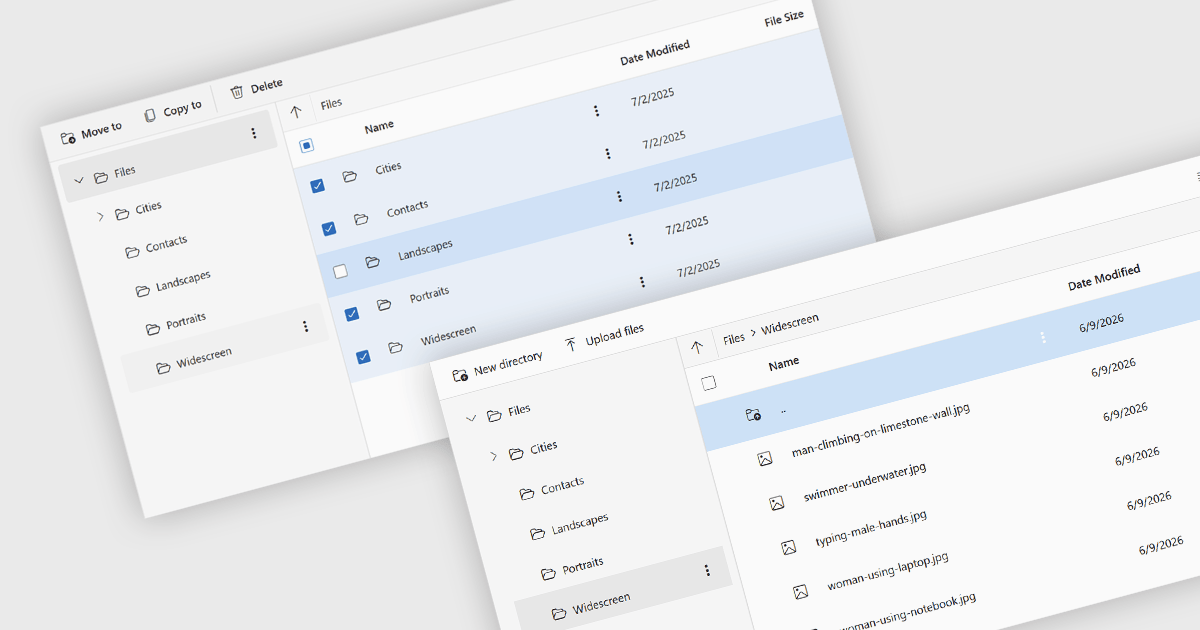
File management and shell components provide developers with tools for working with files, folders, and operating system resources within their applications. These components can provide capabilities such as file browsing, file operations, document handling, and integration with operating system features including file dialogs, shortcuts, shell metadata, and special folders. By providing pre-built functionality for these tasks, file management and shell components can reduce implementation effort and help deliver a familiar user experience.
Several JavaScript UI suites provide you with file management components, including:
For an in-depth analysis of features and price, visit our comparison of JavaScript UI suites.
Data filtering and grouping in reporting enables developers to create reports that organize and display data based on user defined criteria, making complex datasets more accessible and actionable. Filtering allows users to focus on the most relevant records, while grouping structures data into meaningful categories that reveal trends, patterns, and relationships. Together, these capabilities improve report clarity, reduce the time required to analyze information, support more informed decision making, and provide a more flexible and efficient reporting experience for both technical and business users.
Several JavaScript reporting controls offer data filtering and grouping including:
For an in-depth analysis of features and price, visit our comparison of JavaScript Reporting Controls.


Tél : (888) 850 9911
Fax : +1 770 250 6199


