


Fournisseur officiel
Comme nous somme les distributeurs officiels et autorisés, nous vous fournissons des licences légitimes directement à partir de 200+ éditeurs de logiciels.
Voyez toutes nos marques.
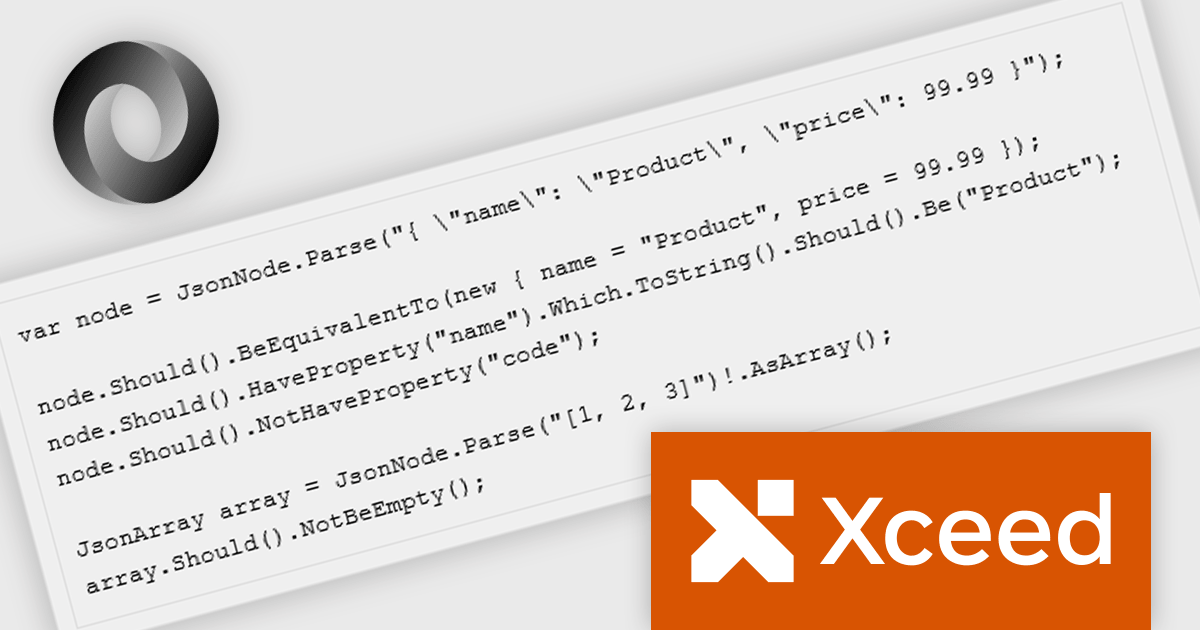
Xceed Fluent Assertions, developed by Xceed Software, is a new .NET library designed to enhance the readability and maintainability of unit tests. It provides a fluent interface for expressing assertions, allowing developers to write more natural and expressive test code. Instead of relying on traditional, often convoluted assertion syntax, Xceed Fluent Assertions enables developers to chain together methods that clearly articulate the expected outcomes of their tests. This promotes a more declarative style of testing, making it easier to understand the intent and logic behind each test case.
The Fluent Assertions 8.7 update introduces JSON-native assertions with first-class JSON support, enabling developers to validate JSON payloads directly within their tests. This enhancement allows precise verification of structure, data types, and values on JsonNode and JsonArray objects without the need for manual parsing or custom helper methods. By treating JSON as a native element in the assertion framework, the update improves API and integration testing, improves test clarity, and reduces maintenance overhead associated with complex JSON comparisons.
To see a full list of what's new in v8.7, see our release notes.
Xceed Fluent Assertions is licensed per developer and is available as a perpetual license with 1 year of updates and support. See our Xceed Fluent Assertions licensing page for full details.
Xceed Fluent Assertions is available individually or as part of Xceed Ultimate Suite.
Telerik UI for ASP.NET AJAX is a library of over 120 user interface components designed for developers building Web Forms applications on the ASP.NET AJAX framework. It provides a variety of pre-built and high-performant controls which are fully customizable, ranging from data management to layout, navigation and data visualization. This feature-rich suite allows for the creation of responsive and visually appealing web applications, whilst enabling developers to enhance the user experience and expedite the development process.
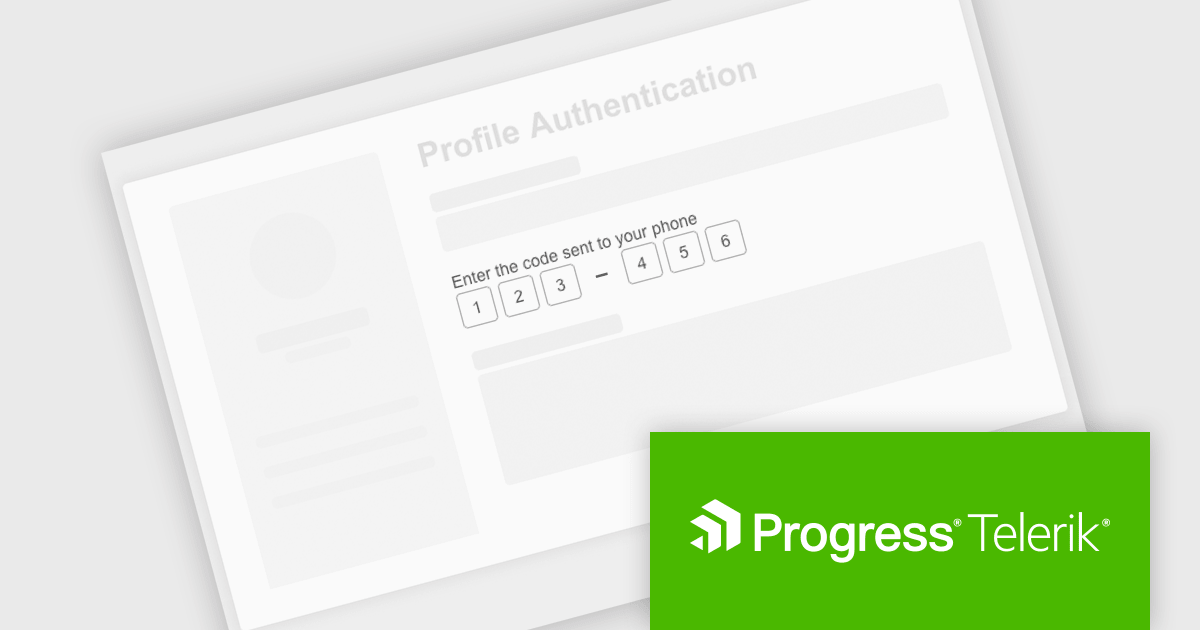
The Telerik UI for ASP.NET AJAX 2025 Q3 update introduces a new One-Time Password (OTP) Input control that enhances application security by improving the integration of multi-factor authentication. This control provides a dedicated interface for handling one-time password entries, ensuring a consistent and reliable verification process across applications. It is fully customizable in terms of size, style, and format, allowing alignment with existing application designs while maintaining strong protection against unauthorized access. This addition simplifies implementation for developers and supports secure workflows such as logins, password resets, and sensitive transactions.
To see a full list of what's new in 2025 Q3 (2025.3.812), see our release notes.
Telerik UI for ASP.NET AJAX is licensed per developer and has two licensing models: an annual Subscription License and a Perpetual License. The Subscription license provides access to the latest product updates, technical support, and exclusive benefits for a flat annual fee, and must be renewed to continue using the software. The Perpetual license is a one-time purchase granting access to the current released version and includes a one-year subscription for product updates and technical support. After this initial period, users can choose to renew the subscription element to continue receiving updates and support; otherwise, they may continue using the installed version available during their active subscription term but will forgo future updates and support. See our Telerik UI for ASP.NET AJAX licensing page for full details.
Telerik UI for ASP.NET AJAX is available individually or as part of the following products:
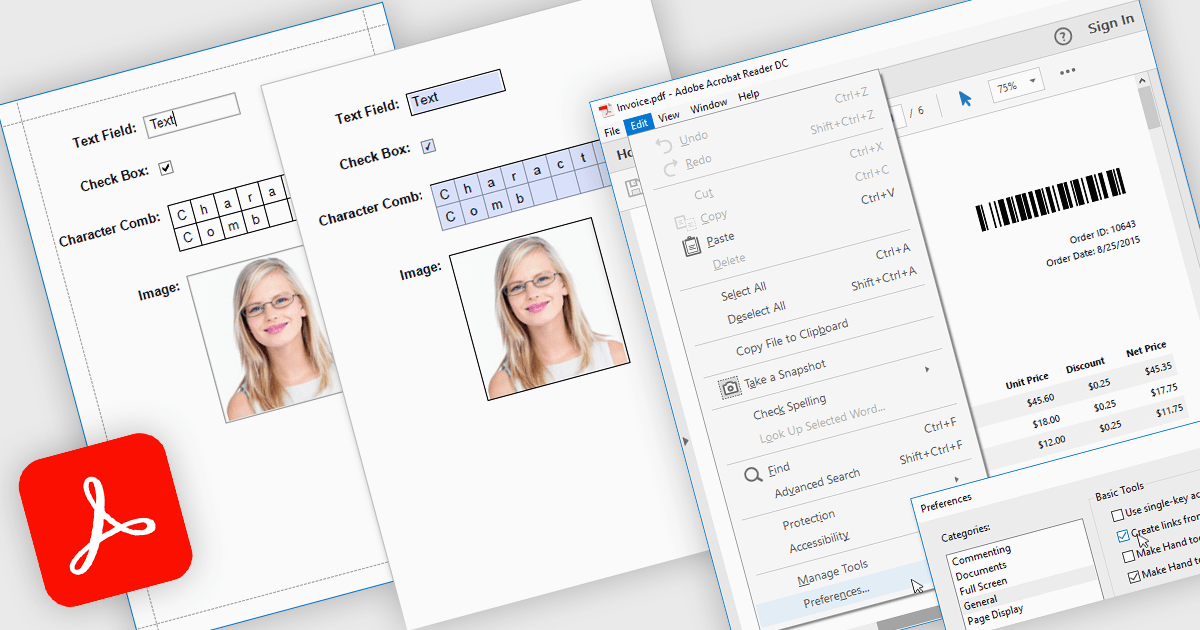
Exporting reports to PDF with AcroForms enables reports to be saved as PDF files containing fully interactive form fields, rather than static text. Editable elements such as text boxes, checkboxes, radio buttons, and drop-down lists remain fillable after export, allowing users to complete forms directly in standard PDF viewers like Adobe Acrobat Reader - without the need for specialized software. The benefits are considerable: organizations can reduce manual data entry, maintain consistent formatting across distributed documents, and improve accessibility for end users. For instance, a company might export an invoice report with editable billing details, create a survey that recipients can fill out digitally, or generate compliance forms that clients can complete and return electronically. By embedding interactive fields directly into exported reports, AcroForms help make document workflows more efficient, accurate, and user-friendly.
Several .NET WPF reporting controls offer Export to PDF with AcroForms including:
For an in-depth analysis of features and price, visit our comparison of .NET WPF reporting controls.
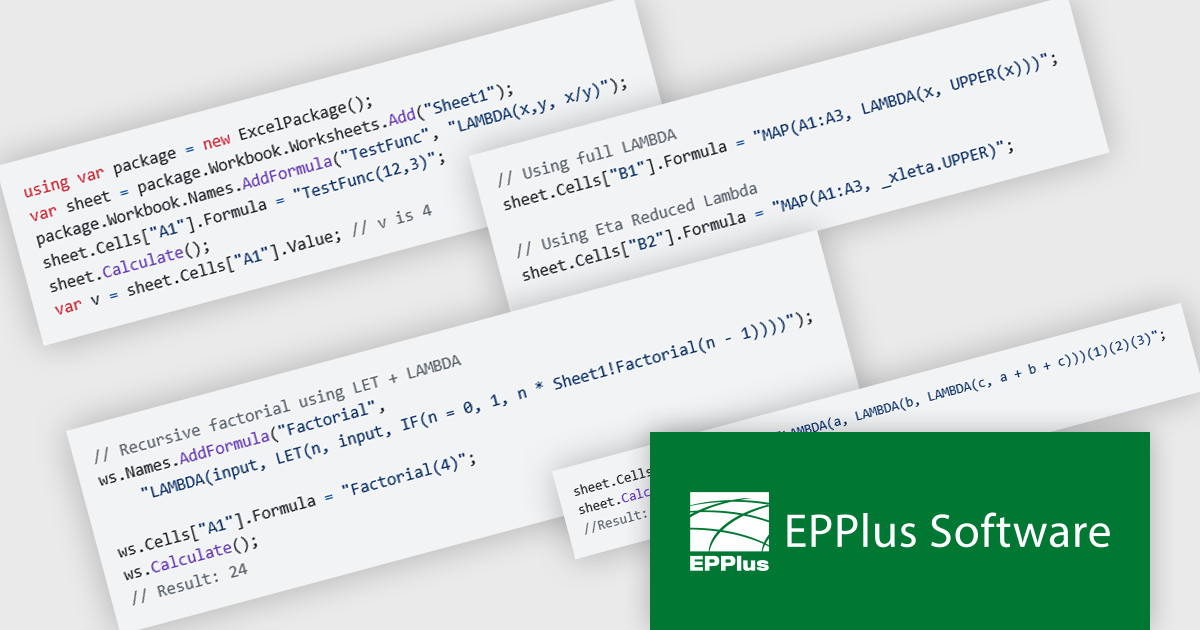
EPPlus is a powerful and versatile .NET library for managing and manipulating Microsoft Excel files using the Office Open XML (OOXML) format. It is a lightweight and efficient library that is easy to use and can be integrated into a wide range of applications. It allows developers to create, read and modify spreadsheets without dependencies on any other library. Features include pivot tables, styling, VBA/Form controls, conditional formatting, charts, tables, formula calculation, data validation, pictures/shapes, and more.
The EPPlus v8.2.0 update introduces support for eight new LAMBDA-based functions, giving developers greater flexibility and control when working with Excel workbook calculations. With these additions, you can now define custom functions directly in the workbook, streamline array transformations, apply operations by row or column, and handle iterative or conditional logic more efficiently. This enhancement reduces the need for repetitive formulas or external code, enabling cleaner, more maintainable spreadsheets that better align with modern programming practices.
To see a full list of what's new in v8.2.0, see our release notes.
EPPlus is licensed per developer and is available as both perpetual licenses and subscription based licenses with periods of 1 year and 2 years, which include support and upgrades. See our EPPlus licensing page for full details.
For more information, see our EPPlus product page.
DevExpress ASP.NET Core is a powerful suite of UI components and reporting tools designed to enhance the development of modern, data-driven web applications built with ASP.NET Core. It leverages the flexibility of client-side JavaScript libraries like DevExtreme with the ease of server-side ASP.NET Core Razor syntax and Web APIs. This hybrid approach allows developers to build rich, responsive UIs with features like data grids, editors, schedulers, and charts, while maintaining the productivity and control of server-side development.
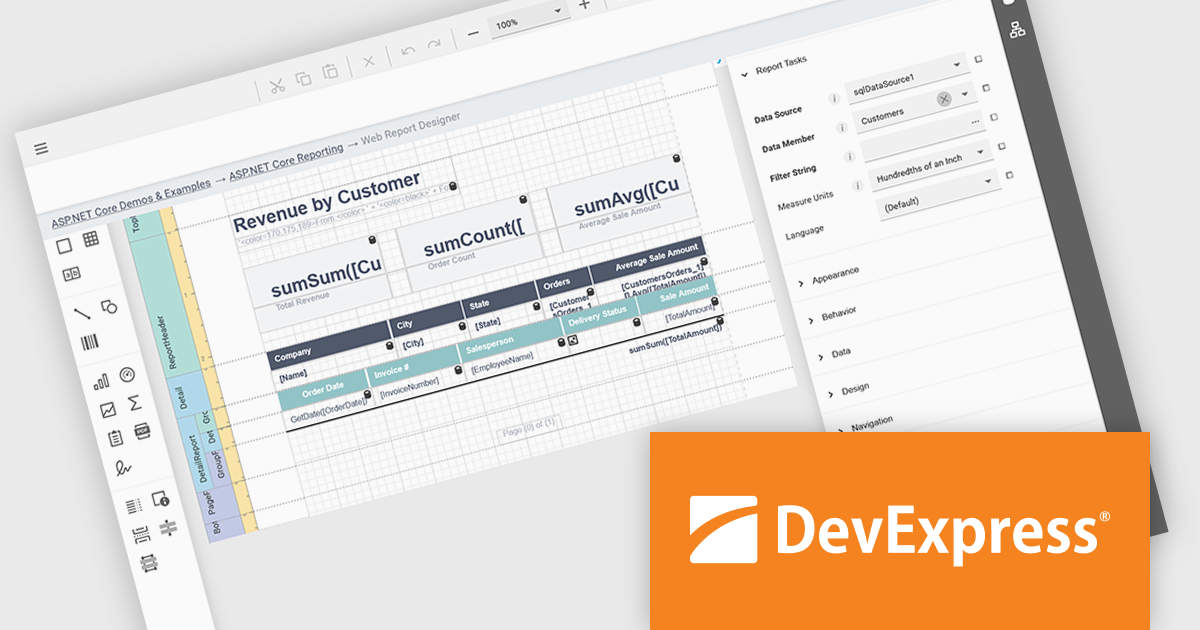
DevExpress ASP.NET Core Reporting includes a web-based report designer that lets users build and edit reports directly in their browser. This removes the need for separate desktop tools or installations, making it easier to deploy and manage. The browser-based approach works across platforms and provides a consistent interface for editing layouts, data connections, and formatting. It also allows business users to handle report changes on their own, reducing the amount of hands-on support developers need to provide, while fitting easily into existing ASP.NET applications.
DevExpress ASP.NET and Blazor is licensed per developer and is available as a Perpetual License with a 12 month support and maintenance subscription. See our DevExpress ASP.NET and Blazor licensing page for full details.
DevExpress ASP.NET and Blazor is available to buy in the following products:


Tél : (888) 850 9911
Fax : +1 770 250 6199


