


Fournisseur officiel
Comme nous somme les distributeurs officiels et autorisés, nous vous fournissons des licences légitimes directement à partir de 200+ éditeurs de logiciels.
Voyez toutes nos marques.
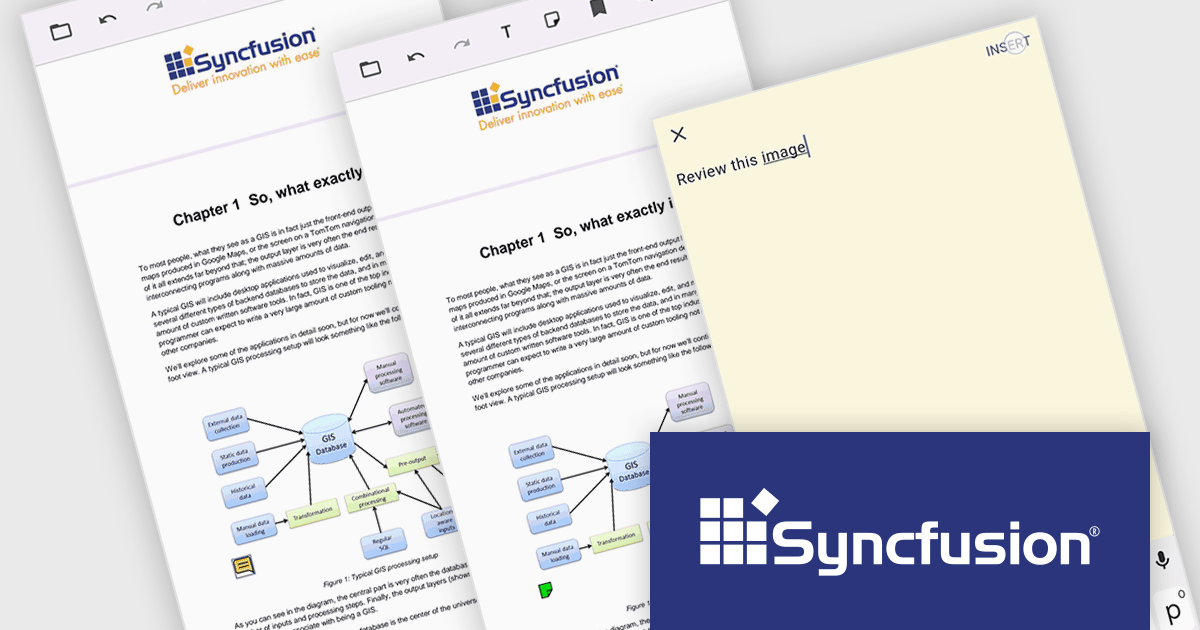
Syncfusion Essential Studio Flutter, available as part of Syncfusion Essential Studio Enterprise, is a powerful UI toolkit that enables you to build beautiful and performant mobile apps for Android and iOS using Flutter. It provides a rich suite of pre-built widgets for common design elements like charts, data grids, calendars, and PDF viewers. These widgets are highly customizable and allow you to quickly implement stunning visuals and advanced functionalities without spending time on repetitive coding.
The Syncfusion Essential Studio Flutter 2024 Volume 3 release adds support for sticky note annotations to the PDF Viewer control. This allows users to add, remove, and modify sticky note annotations in PDF files. Users can also add comments or notes to specific parts of a document to clarify complex concepts or terms. The addition of sticky note annotations enriches document interaction by enabling users to add comments directly on specific sections of a PDF, fostering better collaboration and understanding. This feature is ideal for team-based workflows, such as code reviews, project documentation, and shared technical resources, where team members can leave contextual feedback or explanations without altering the main content. It also benefits individual users, allowing them to add personal reminders or detailed notes for future reference. The option to modify or delete annotations ensures that all notes remain relevant, making this feature a powerful tool for both collaborative and personal document workflows.
To see a full list of what's new in 2024 Volume 3, see our release notes.
Syncfusion Essential Studio Flutter is available as part of Syncfusion Essential Studio Enterprise which is licensed per developer starting with a Team License of up to five developers. It is available as a 12 Month Timed Subscription License which includes support and maintenance. See our Syncfusion Essential Studio Enterprise licensing page for full details.
Learn more on our Syncfusion Essential Studio Flutter product page.
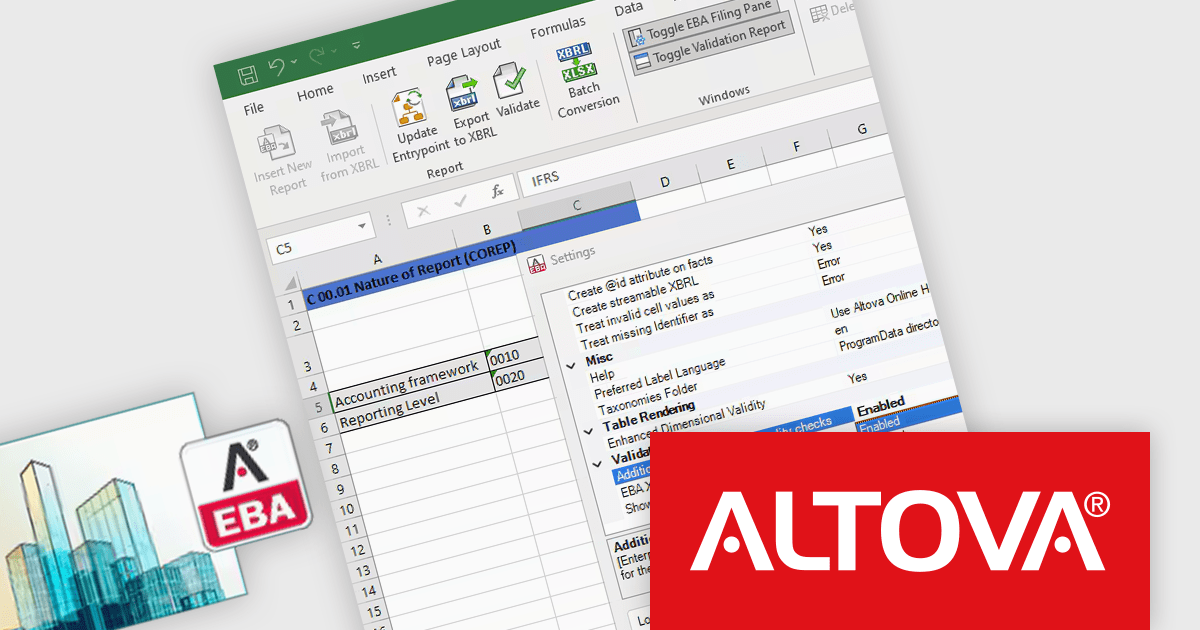
Altova's new EBA XBRL Add-in for Excel simplifies the process of EBA-compliant report generation by shielding financial professionals from complex XBRL syntax. This tool allows users to create reports that meet European Banking Authority (EBA) XBRL Filing Rules within Microsoft Excel, making regulatory compliance easier and more accessible in a familiar workspace.
The EBA XBRL Add-in 2025 release introduces advanced, optional data quality checks designed to improve accuracy and streamline regulatory compliance for financial institutions. These new checks complement the mandatory EBA XBRL validations, offering a proactive way to identify and resolve data issues prior to submission, reducing the risk of costly errors or rejections. Particularly beneficial for institutions aiming to optimize their reporting processes, this feature is ideal for those handling complex financial data and striving to maintain high standards in regulatory filings. With the add-in’s intuitive interface in Excel, users can perform comprehensive quality checks efficiently, all within their preferred workflow.
To see a full list of what's new in version 2025, see our release notes.
Altova XBRL Add-in is licensed per year, per server, based on the number of cores available on the machine. See our Altova EBA XBRL Add-in licensing page for full details.
For more information, visit our Altova EBA XBRL Add-in product page.
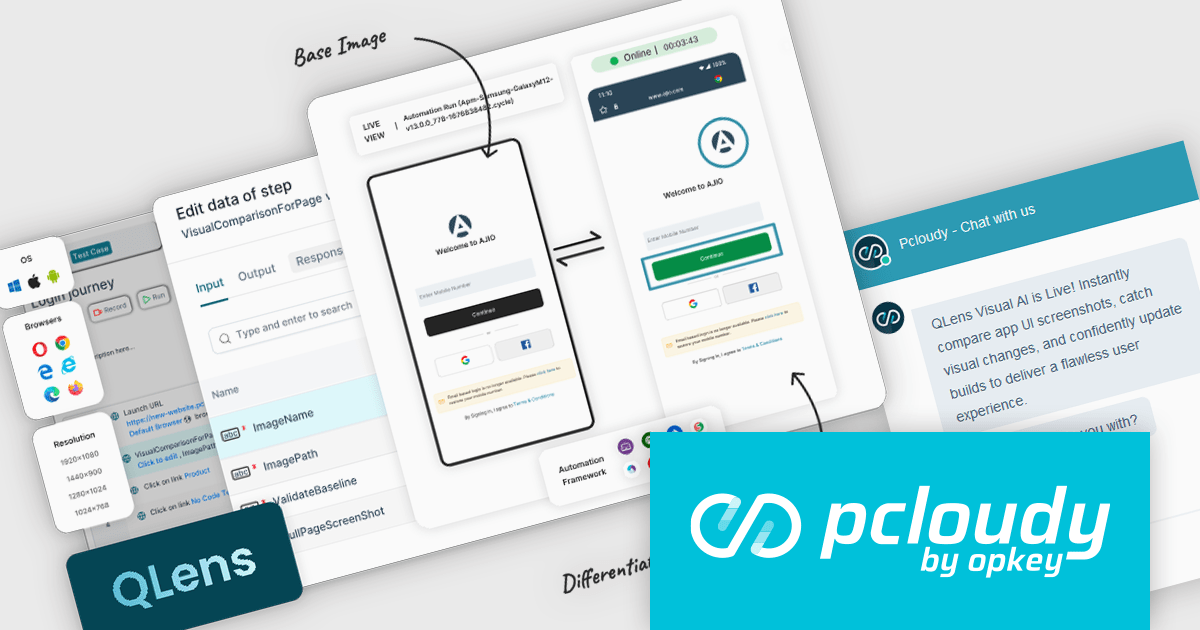
Pcloudy is a unified app testing platform that helps developers and testers ensure the quality and functionality of their applications across a wide range of devices and browsers. It provides a cloud-based infrastructure for manual and automated testing, offering access to thousands of real devices and browser combinations.
The Pcloudy 6.13 release introduces Qlens, a powerful AI-driven visual testing tool designed to enhance usability and streamline app quality assurance. The tool works to instantly verify app workflow screenshots, ensuring UI consistency and precisely identifying visual discrepancies. This feature allows teams to monitor app workflows efficiently, validate interface elements, and maintain seamless user experiences. Ideal for rapid usability testing, QLens accelerates visual validation across development cycles, making it an essential tool for ensuring polished, cohesive app designs in dynamic, high-stakes environments.
To see a full list of what's new in 6.13, see our release notes.
Pcloudy is offered as a 1 year subscription, licensed per user, per parallel session. Licenses are available for Manual or Automated Testing, for Web or Mobile. See our Pcloudy licensing page for full details.
For more information, visit our Pcloudy product page.
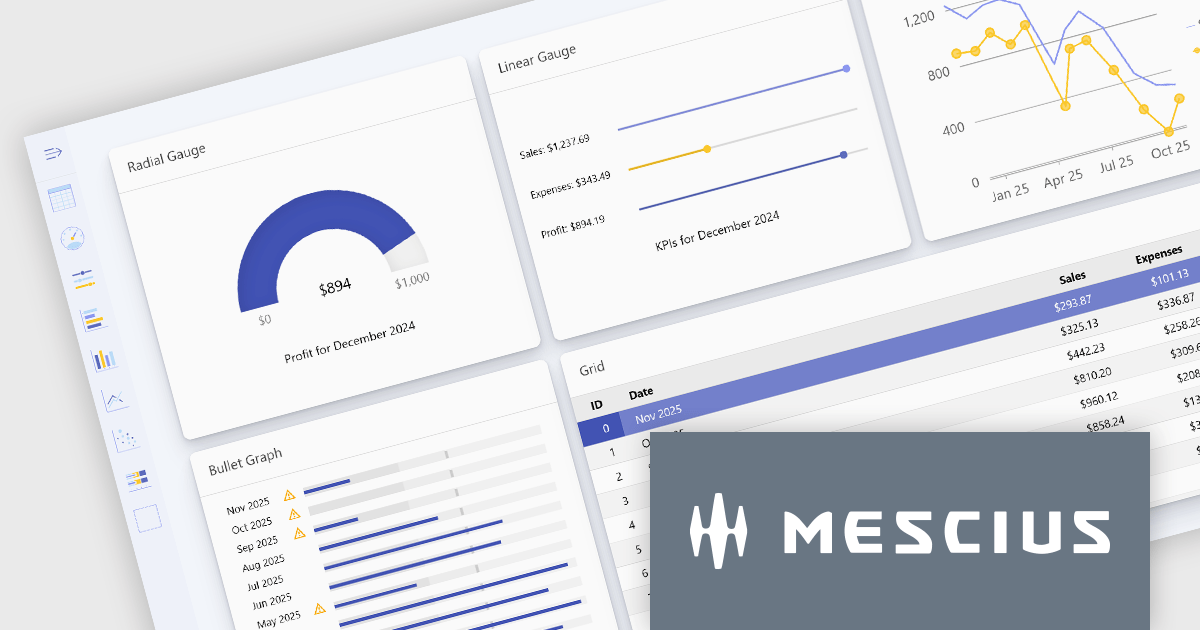
Wijmo is a complete collection of extensible, fast, flexible JavaScript UI components written in TypeScript. The framework-agnostic Wijmo components include first-class support for top frameworks including Angular, React, Vue and Web Components. Wijmo Enterprise has over 100 dynamic UI components to help cut your development time in half, allowing you to build lightweight, high-performance JavaScript applications using your favorite JavaScript framework.
Wijmo's dynamic dashboard sample allows users to create customizable, interactive dashboards, similar to those seen in Google Analytics. The new version of the dashboard, now built with React, offers a range of key features including touch-screen support, drag-and-drop functionality, and pre-defined tile types, making it an ideal solution for users looking to create personalized, data-rich visualizations.
In this blog post, MESCIUS Product Marketing Specialist Grant Katanick takes you through the steps for creating a dynamic dashboard for your JavaScript web applications. Key features of the React-based dashboard include:
Detailed sample source code is included that you can use as a starting point for your actual dashboard applications.
Read the complete blog to get started building dynamic dashboards with React and Wijmo.
Wijmo is licensed per developer. Developer licenses are perpetual and include 1 year subscription which provides upgrades, including bug fixes and new features. See our Wijmo licensing page for full details.
For more information, visit our Wijmo product page.
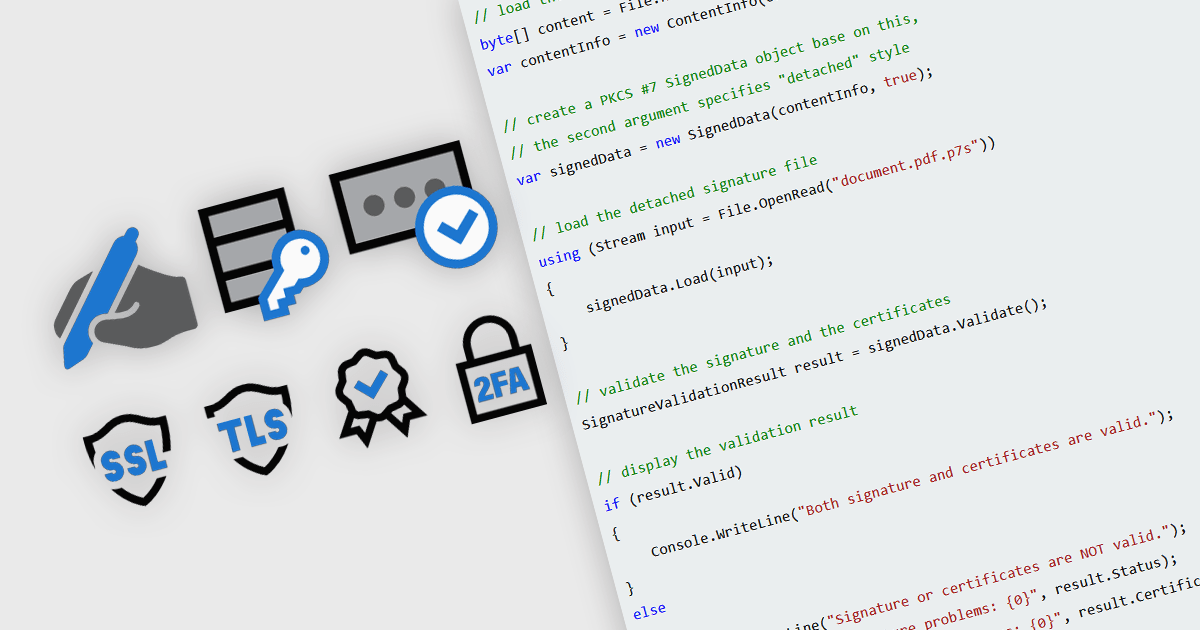
In modern communications and messaging platforms, security features are essential for safeguarding data integrity, user privacy, and system reliability. These features encompass a range of protocols and mechanisms designed to protect data from unauthorized access, ensure data authenticity, and verify the identity of communicating parties. By integrating security measures such as encryption, authentication, and digital certificates, organizations can mitigate risks and enhance trust within their digital ecosystems. Effective security within messaging and communication systems not only prevents data breaches but also ensures compliance with regulatory standards and supports secure collaboration across teams and partners.
Common features include:
For an in-depth analysis of features and price, visit our .NET communications and messaging components comparison.


Tél : (888) 850 9911
Fax : +1 770 250 6199


