








Fournisseur officiel
Comme nous somme les distributeurs officiels et autorisés, nous vous fournissons des licences légitimes directement à partir de 200+ éditeurs de logiciels.
Voyez toutes nos marques.
Effective January 2, 2025, JetBrains will discontinue continuity discounts for new subscriptions across its range of products. This applies to IDEs like IntelliJ IDEA and PyCharm, Visual Studio tools such as ReSharper, as well as the All Products Pack and dotUltimate bundles.
This change means that while customers renewing existing licenses will continue to enjoy their current discount rates, any new licenses purchased after January 2nd, 2025 will not be eligible for continuity discounts.
For subscriptions purchased before this deadline, the following discounts still apply:
If you're thinking about adding new licenses for JetBrains products that you already own, or if you've been considering your first purchase, now is the perfect time to act! Make any new subscription purchases before the January 2, 2025 deadline to take advantage of these generous discounts.
Need help to find the right JetBrains license or want a personalized quote? Call, Email, or Live Chat with our licensing experts.
Explore the JetBrains product range and ensure you keep your continuity discount on renewals.

Bullet charts are efficient data visualization tools designed to display performance metrics against a target within a single, streamlined bar. Ideal for compact spaces on dashboards, bullet charts convey a KPI's current status, target, and performance range in a minimalist view, making them perfect for summarizing key data points without overwhelming the interface. They are highly customizable, supporting varied colors, labels, and thresholds, and their component-based structure in React allows developers to implement real-time updates, enabling users to monitor changing data continuously. These charts promote a responsive, interactive experience, providing powerful options for building detailed, data-rich applications.
Several React chart controls offer bullet chart support including:
For an in-depth analysis of features and price, visit our React bullet chart controls comparison.

Charts in a dashboard component transform raw data into clear, actionable visuals, making it easy to monitor trends, track performance, and spot critical insights in real time. These interactive tools support various use cases, from sales forecasting and KPI tracking to project progress monitoring and customer behavior analysis. By offering a centralized, intuitive view of essential metrics, charts help teams make faster, data-driven decisions, optimize operational efficiency, and respond proactively to emerging opportunities or issues.
Several JavaScript products offer chart components with dashboard support including:
Explore our range of JavaScript dashboard components.
Need help to find the right software license, upgrade or renewal? Call, Email, or Live Chat with our experts.
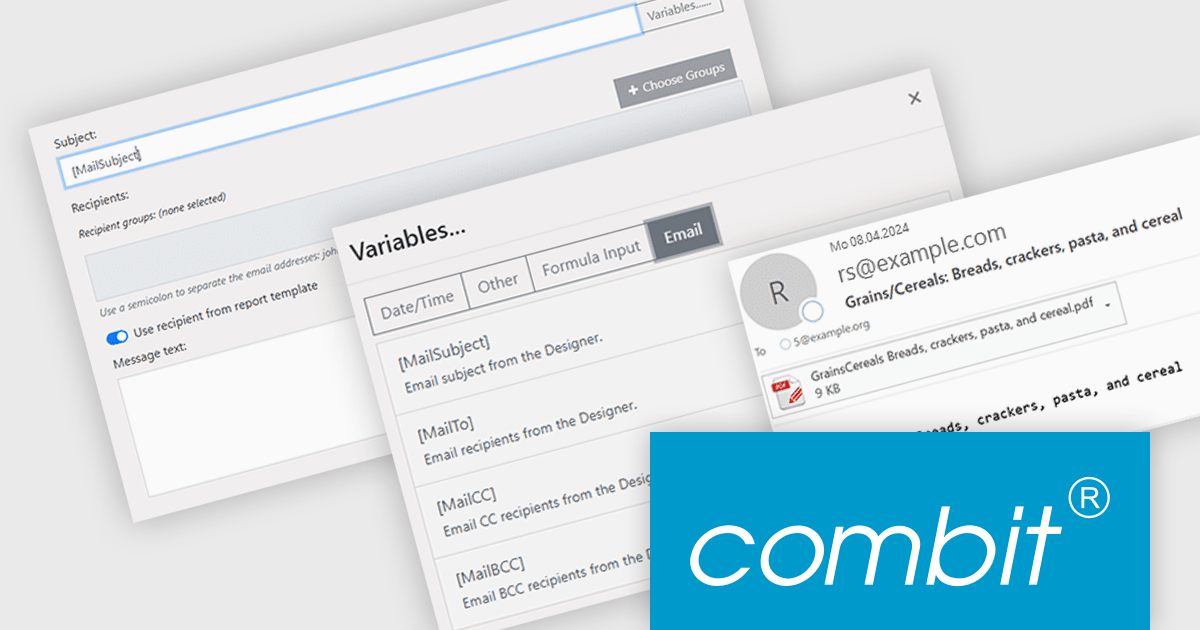
combit Report Server (included as part of List & Label Enterprise Reporting Edition) is a versatile BI reporting solution which can be used standalone or integrated into your List & Label applications. It can be customized to match your corporate design and enables platform-agnostic report generation, scheduling, and exporting from a variety of data sources in multiple formats and languages.
The combit Report Server version 30 update introduces a new "email per record" function that enhances report distribution. This grants developers the ability to automatically generate and send individual emails for each data record in a report. By eliminating the need for manual email creation and sending for large datasets, developers can save time and resources while ensuring timely and accurate delivery of information. This capability is particularly useful in scenarios with high data variability, such as invoicing, order processing, or customer notifications, where each recipient needs different information from the same report.
To see a full list of what’s new in version 30, see our release notes.
combit Report Server is licensed as part of List & Label Enterprise Edition. List & Label is licensed per developer and is available as a Perpetual License with a 12 month support and maintenance subscription. See our combit Report Server licensing page for full details.
Report Server is available to buy in the following products:

Printing functionality in reporting controls allows users to generate physical or digital copies of reports directly from within the software, ensuring seamless access to formatted, ready-to-distribute documents. This capability is especially valuable in data-driven applications where users need to share insights in a standardized format, such as in financial, operational, or compliance reporting. With printing support, users can define how reports appear on paper or in PDF format, often choosing custom layouts, page sizes, or specific sections for export, all of which aid in producing polished and accessible presentations of data. By reducing the manual steps needed to prepare data for distribution, printing functionality helps streamline workflows and enhance the utility of reporting tools for both internal and external stakeholders.
Several React reporting controls offer printing support including:
For an in-depth analysis of features and price, visit our React Reporting controls comparison.





Tél : (888) 850 9911
Fax : +1 770 250 6199


