


Fournisseur officiel
Comme nous somme les distributeurs officiels et autorisés, nous vous fournissons des licences légitimes directement à partir de 200+ éditeurs de logiciels.
Voyez toutes nos marques.

Mootools Software is a French software company specializing in 3D and mesh optimization technologies. Known for their innovative solutions, they offer standalone software, plugins for leading 3D platforms like 3DS Max, Maya, and Lightwave, and a robust C++ SDK for Windows, macOS, and Linux. Their flagship product, Polygon Cruncher, simplifies complex 3D meshes with millions of polygons at incredible speed, while 3DBrowser Pro helps professionals manage, convert, and preview 3D files with ease. With decades of expertise and cutting-edge algorithms, Mootools Software continues to be a leader in the 3D development space.
Over the past year, ComponentSource and Mootools Software have worked hand in hand to make these advanced technologies available to a global community of developers. By offering streamlined access, flexible licensing, and trusted distribution, ComponentSource have helped ensure that customers can rely on Mootools Software’s solutions.
This partnership has made it easier than ever for developers to bring efficiency and creativity into their 3D projects. Whether optimizing assets for video games, simplifying CAD models, or preparing 3D scans for cultural preservation, the collaboration empowers users to work faster, smarter, and with more confidence. ComponentSource look forward to continuing their partnership with Mootools Software, driving innovation and delivering trusted solutions for the years ahead.
Learn more about Mootools Software.
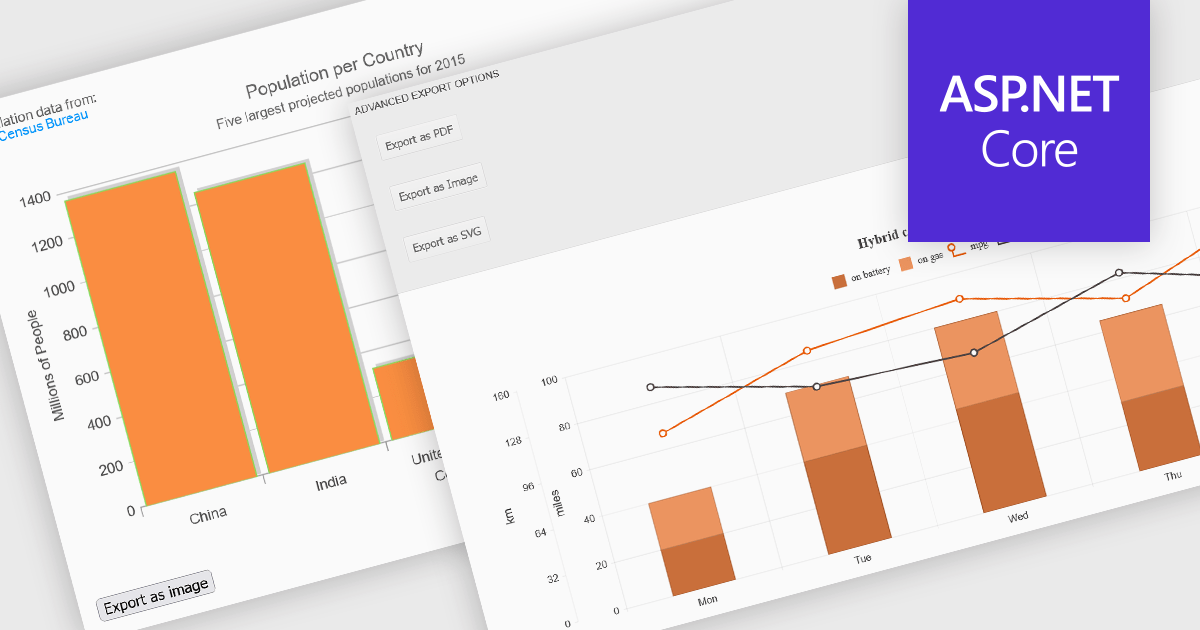
Export features in charting components allow developers and users to take visualized data beyond the browser, whether for sharing, archiving, or integrating into reports and presentations. These tools support a wide range of formats and workflows, transforming interactive charts into portable assets that can be printed, saved, or embedded in other applications. By offering export capabilities alongside dynamic charting, modern components bridge the gap between visual exploration and formal communication of data, ensuring insights can be distributed effectively in both digital and hardcopy formats.
Common features include:
For an in-depth analysis of features and price, visit our ASP.NET Core charting components comparison.
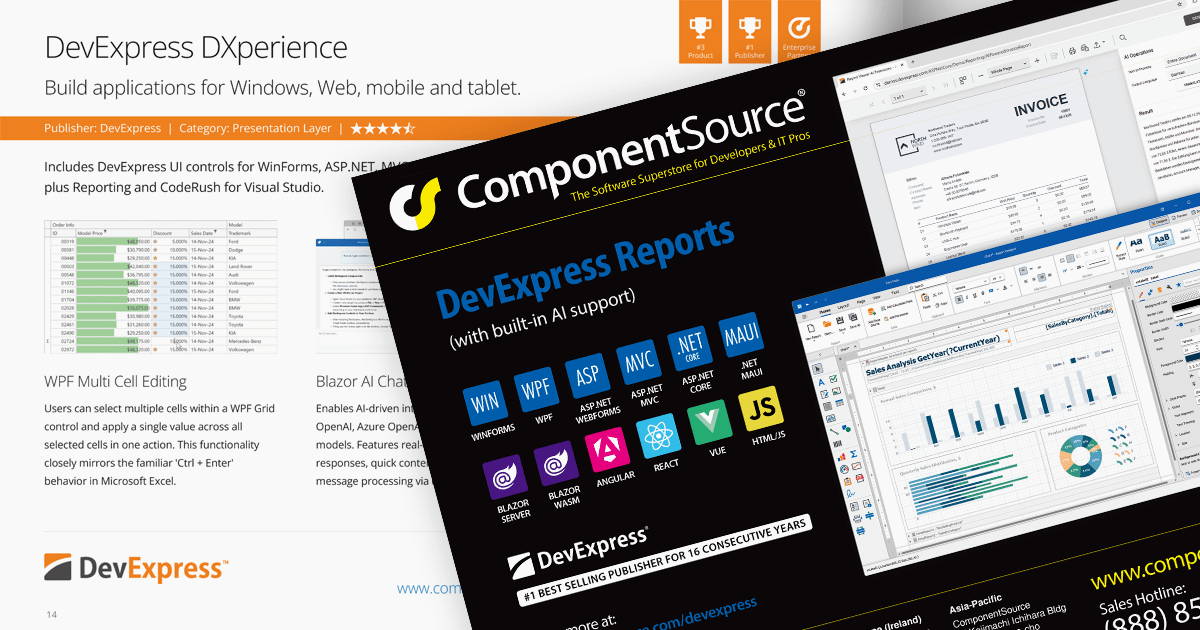
We are pleased to announce the publication of issue #118 of the ComponentSource Showcase Catalog. The latest edition includes a selection of components and tools designed to meet the needs of software developers and IT professionals.
Over the last 30 years, ComponentSource has built a comprehensive marketplace to help its users discover, compare and buy Enterprise-grade software components and tools. The ComponentSource Catalog showcases a range of products in an easy-to-digest print publication.
Issue #118 features an assortment of components and tools from market leading publishers including:
Products include file format APIs, reporting solutions, user interface controls for .NET and JavaScript, communications components, and much more.
Available in English, German, Korean and Japanese editions, the 48-page full color publication lets you easily browse selected products and read about highlighted features. If you want more information, the QR codes on each page (and links in the PDF version) take you directly to that product's page on the ComponentSource website.
You can browse the latest issue online or visit the ComponentSource Showcase Catalog page to download a PDF.
To receive your FREE physical copy of future issues (available in Europe, US, Canada, Japan and South Korea), simply follow these steps:
We'll deliver a new issue direct to your door four times per year.
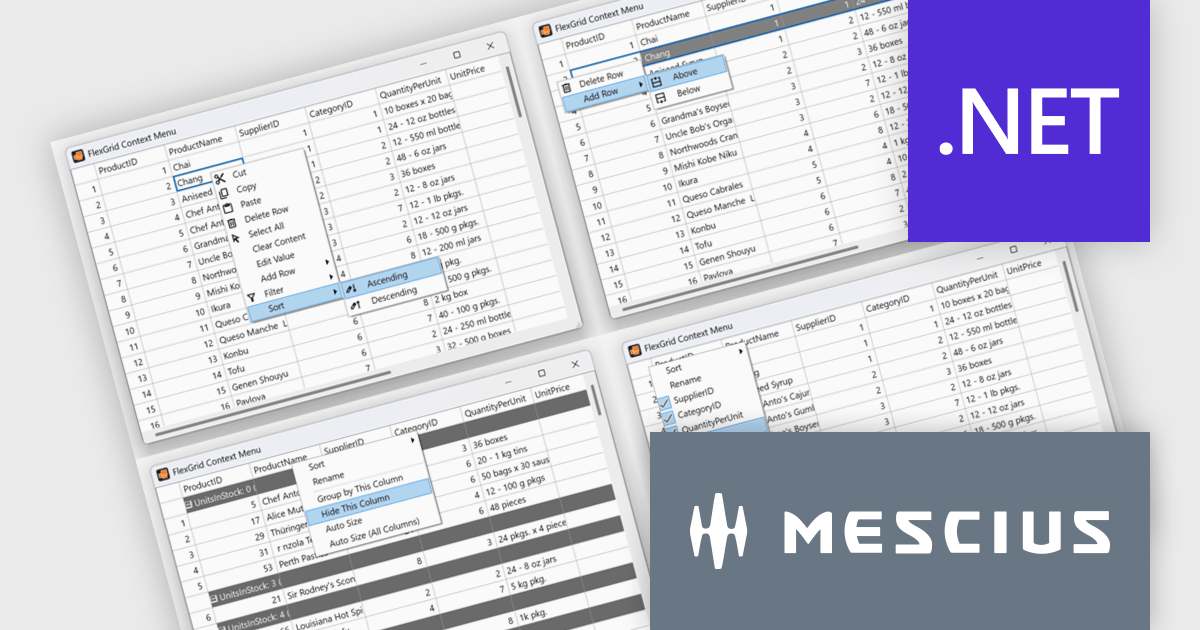
ComponentOne Studio Enterprise is a comprehensive suite of .NET UI controls developed by MESCIUS (formerly GrapeCity) designed for building rich, interactive desktop, web, and mobile applications. It provides developers with a broad range of tools and components-including data grids, charts, reports, input controls, and advanced data visualization features-for platforms such as WinForms, WPF, ASP.NET Core, Blazor, WinUI, and .NET MAUI. The suite emphasizes performance, flexibility, and ease of integration, helping teams create consistent, feature-rich user experiences across multiple application types while maintaining a unified development approach.
The ComponentOne 2025 v1.2 update includes a new sample demonstrating a complete, custom context menu solution for FlexGrid. It allows developers to define context-aware actions that adapt to different parts of the grid. This enables right-click functionality to insert rows, sort or group columns, and open a column picker directly within the grid. Developers benefit from the flexibility of FlexGrid’s API to implement tailored solutions while providing end users with a familiar, Excel-like experience that enhances efficiency and precision in data management tasks.
To see a full list of what's new in 2025 v1.2, see our release notes.
ComponentOne Studio Enterprise is licensed per developer on a perpetual basis and includes a 12 month subscription. Priority Support is also available. See our ComponentOne Studio Enterprise licensing page for full details.
Learn more on our ComponentOne Studio Enterprise product page.
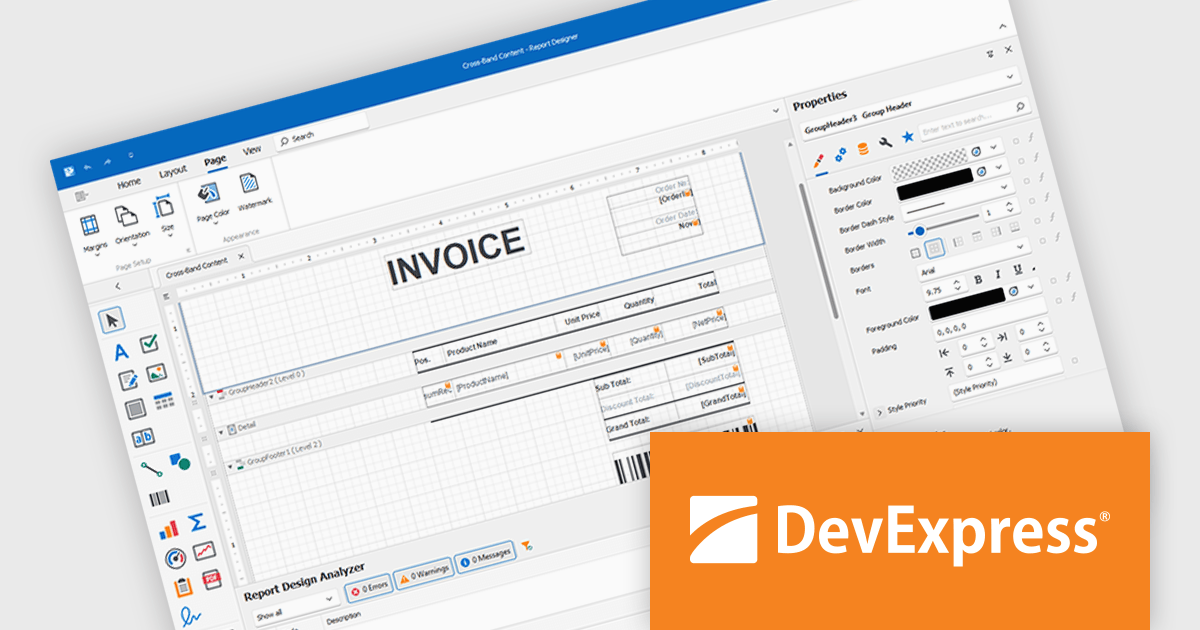
DevExpress Reporting is a comprehensive suite of reporting tools that help developers create visually stunning and highly customizable reports for various applications. With its rich feature set, including data binding, layout design, printing, and exporting capabilities, DevExpress Reporting enables the efficient creation of reports that meet the most demanding business requirements.
DevExpress Reporting lets developers build custom report controls that go beyond the built-in options, making it easier to meet specific project needs. These controls can include unique visual elements or functions that fit naturally into the existing reporting setup, keeping reports consistent in both appearance and behavior. Custom controls also help standardize design, support reusable logic, and handle specialized data presentation that standard controls may not cover, improving maintainability and scalability over time.
DevExpress Reporting is licensed per developer and is available as a Perpetual License with a 12 month support and maintenance subscription. See our DevExpress Reporting licensing page for full details.
DevExpress Reporting is available to buy in the following products:


Tél : (888) 850 9911
Fax : +1 770 250 6199


