


Fournisseur officiel
Comme nous somme les distributeurs officiels et autorisés, nous vous fournissons des licences légitimes directement à partir de 200+ éditeurs de logiciels.
Voyez toutes nos marques.
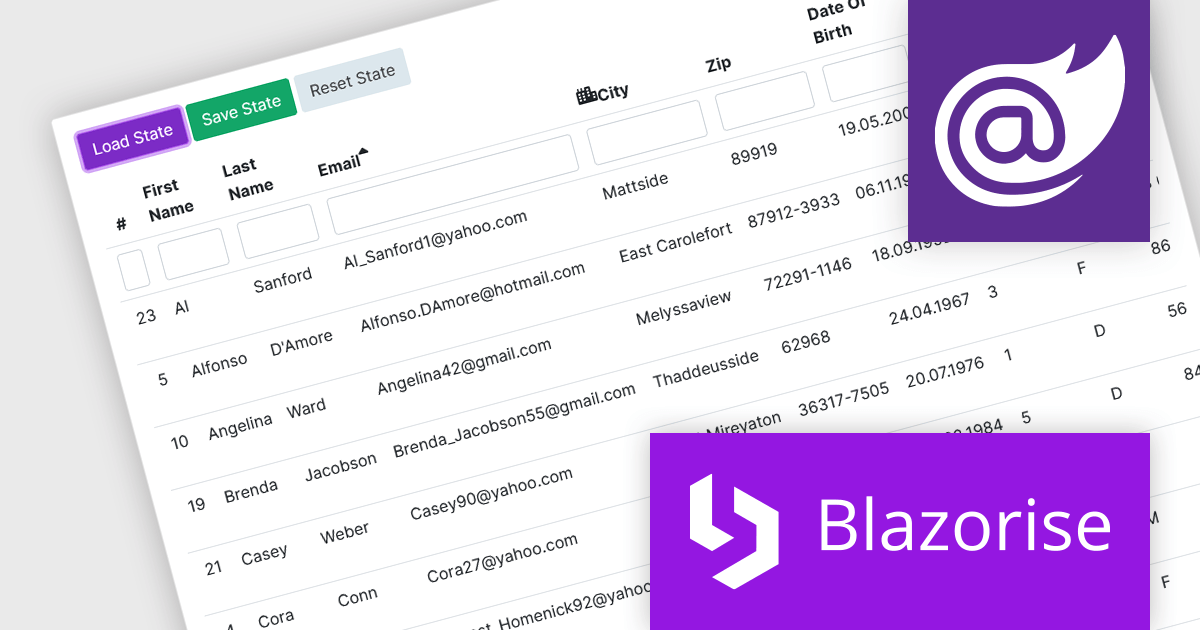
Blazorise is a versatile component library that empowers developers to build modern and feature-rich web applications using Blazor, a client-side web development framework from Microsoft. It offers a comprehensive collection of user interface components, including buttons, forms, tables, charts, and navigation elements, all built with accessibility and responsiveness in mind.
The Blazorise v1.5 update introduces DataGrid State Management. New LoadState and GetState methods enable you to load and save the state of the datagrid from/to LocalStorage. On the first render, the web page checks LocalStorage for saved states and loads them if they are available. This feature enables seamless preservation and restoration of user actions, such as sorting, filtering, and row selections, even when navigating away from or refreshing the page.
To see a full list of what’s new in version 1.5, see our release notes.
Blazorise is licensed per developer and is Runtime Royalty Free. Available in a variety of editions, Professional, Enterprise and Enterprise Plus, each providing different levels of support and services. See our Blazorise licensing page for full details.
For more information, visit our Blazorise product page.
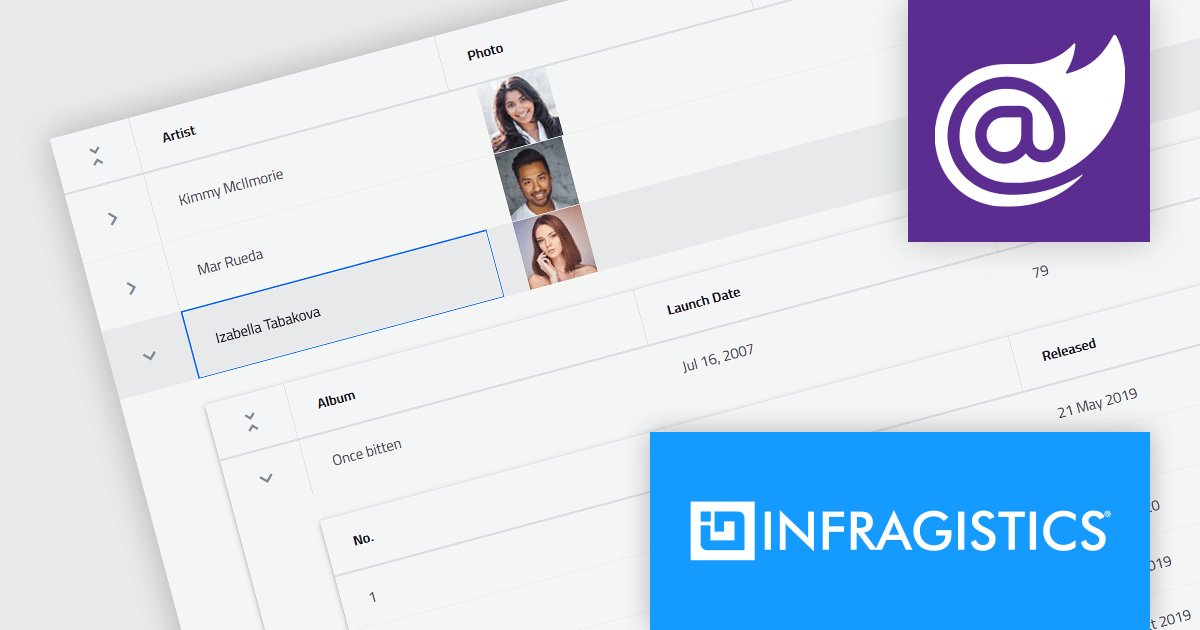
Infragistics Ignite UI for Blazor is a comprehensive UI component library designed specifically for .NET developers building modern web applications with Blazor. It offers a rich set of over 60 components, including performant data grids, interactive charts, and essential UI elements. This allows developers to craft visually appealing, feature-packed Blazor applications with a focus on data visualization, user interaction, and a variety of design themes.
Version 23.2.189 introduces the new hierarchical data grid. This intuitive component empowers you to present multi-level information in a clear, structured format. Bind your data with minimal coding, and leverage fine-grained control through various events. The grid boasts a rich feature set, including selection tools, advanced filtering and sorting options, all designed to enhance user experience by providing a more organized and interactive way to explore information.
To see a full list of what's new in version 23.2.189, see our release notes.
Infragistics Ignite UI for Blazor is part of Infragistics Ignite UI which is licensed per developer and is available as a Perpetual License with a 1, 2 or 3 year support and maintenance subscription. See our Infragistics Ignite UI licensing page for full details.
Infragistics Ignite UI for Blazor is available in the following products:
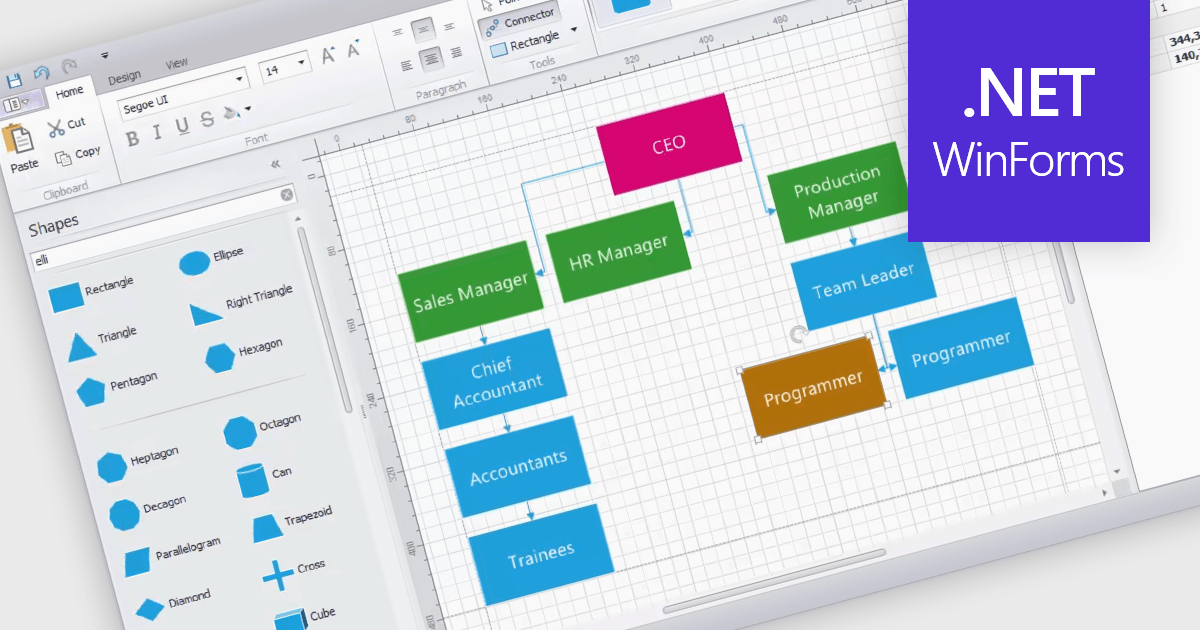
WinForms diagram controls provide a dedicated canvas for users to create and manipulate visual representations. These controls offer functionalities like displaying and editing various shapes, connectors, and text elements. They often come equipped with features for automatic layout, allowing for efficient organization of complex diagrams. Diagrams are commonly used to simplify and communicate complex ideas, processes, or data. They can show relationships between elements, illustrate steps in a sequence, or represent structures and hierarchies.
Several WinForms UI suites feature diagramming components including:
For an in-depth analysis of features and price, visit our WinForms UI Suites comparison.
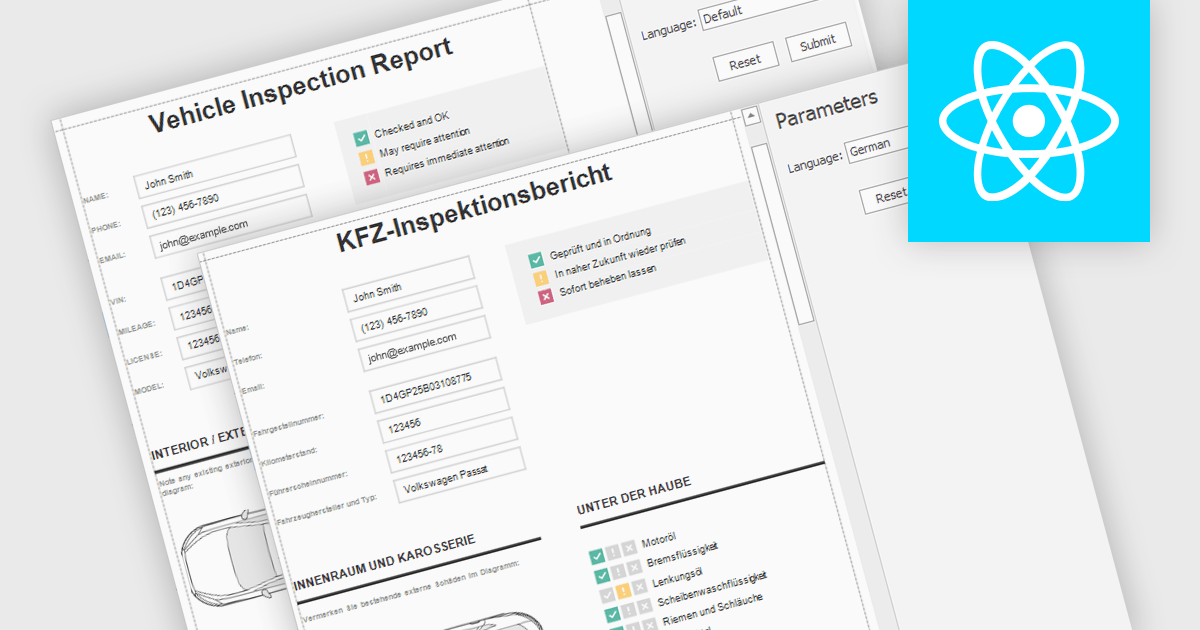
Report localization is the process of adapting a report for a target audience's language and cultural context. This involves translating text elements, formatting dates and currencies appropriately, and potentially adjusting the user interface to accommodate different reading habits such as right-to-left layouts. The goal is to ensure the report is clear, informative, and culturally sensitive for users worldwide.
Several React reporting controls offer localization including:
For an in-depth analysis of features and price, visit our React reporting controls comparison.
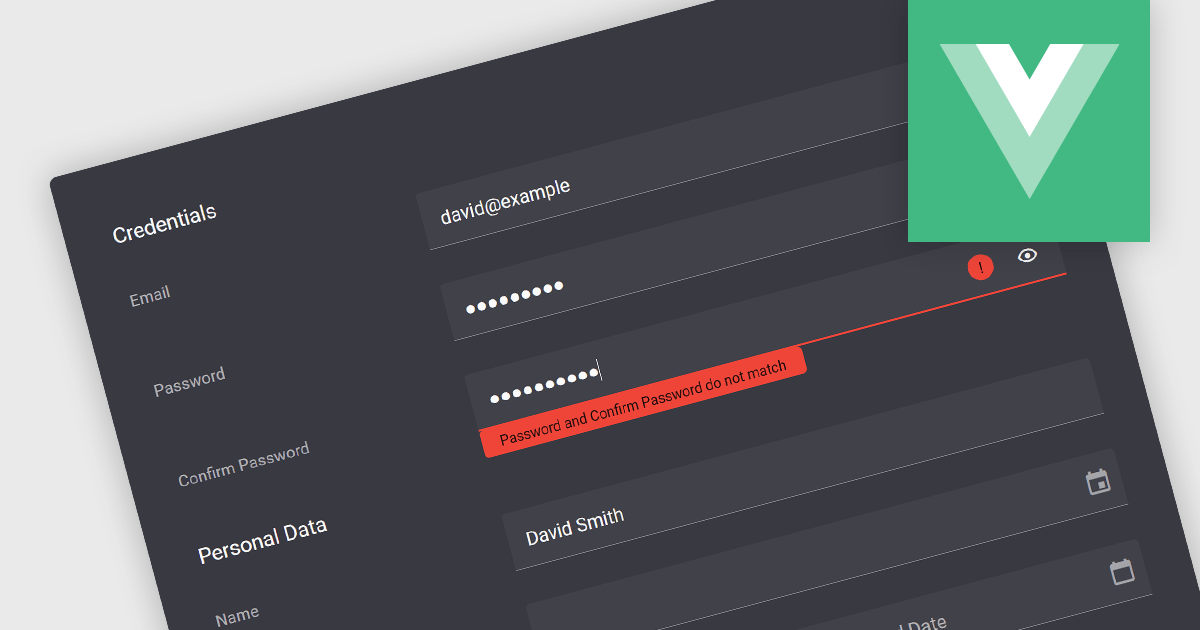
Validation in data editor controls refers to the process of ensuring user-entered information conforms to predefined rules. This helps prevent invalid or erroneous data from being stored in your application. By implementing data validation, you improve data integrity, reduce the need for manual data cleansing, and ultimately streamline the development process by catching errors early on.
Here are some examples of Vue.js data editors that support data validation:
For an in-depth analysis of features and price, visit our comparison of Vue.js Data Editors.


Tél : (888) 850 9911
Fax : +1 770 250 6199


