


Fournisseur officiel
Comme nous somme les distributeurs officiels et autorisés, nous vous fournissons des licences légitimes directement à partir de 200+ éditeurs de logiciels.
Voyez toutes nos marques.
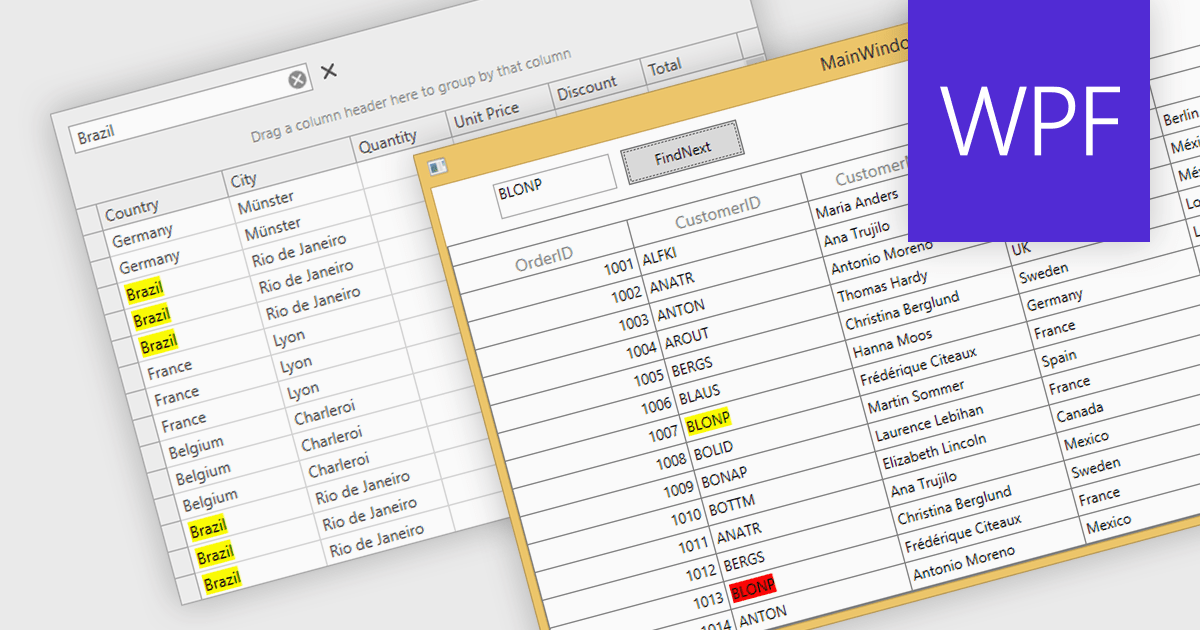
Searching within a grid enables users to quickly find specific data points by entering search criteria. For large datasets, navigating to specific data points can be a monumental task, often requiring time-consuming manual scrolling. Grid search allows users to pinpoint desired data within seconds, boosting productivity and streamlining analysis. This eliminates the need for tedious browsing and empowers users to quickly identify trends, patterns, and outliers, enabling deeper insights and informed decision-making.
Several WPF grids support searching including:
For an in-depth analysis of features and price, visit our WPF grids comparison.
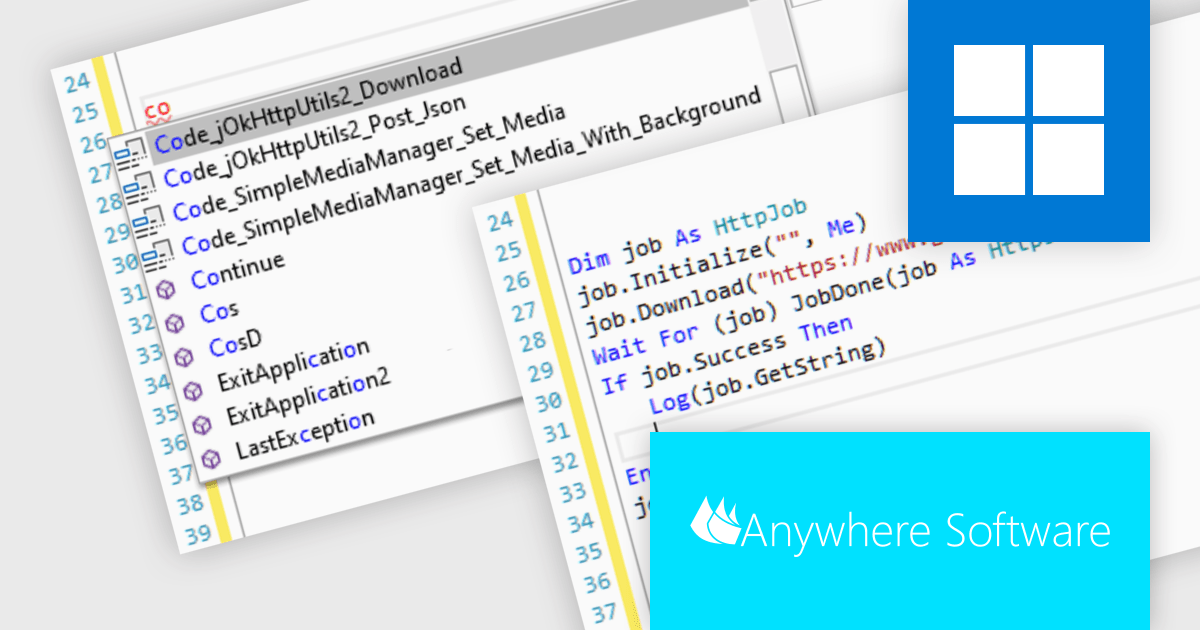
B4i (iOS), by Anywhere Software, is a Rapid Application Development (RAD) tool for building native iOS apps on Windows machines. It shares similar concepts with B4A (Android development), enabling code reuse and cross-platform capabilities. Uniquely, B4i bypasses the need for a local Mac computer, allowing developers to create iOS apps entirely within their Windows environment if they use Anywhere Software's Hosted Mac Builder service to execute the compilation process. B4i offers a powerful solution for Windows developers wanting to tap into the iOS app market.
B4i (iOS) v8.50 introduces support for code snippets. These pre-built code modules, spanning simple loops to entire functions, significantly improve efficiency and promote code consistency, contributing directly to project timelines and code quality.
To see a full list of what's new in v8.50, see our release notes.
B4i (iOS) is licensed per developer and is available as a perpetual license in Standard Edition (with two months of upgrades) or Enterprise Edition (with two years of upgrades). The Hosted Mac Builder Service must be renewed annually to continue using it. See our B4i (iOS) licensing page for full details.
For more information, see our B4i (iOS) product page.
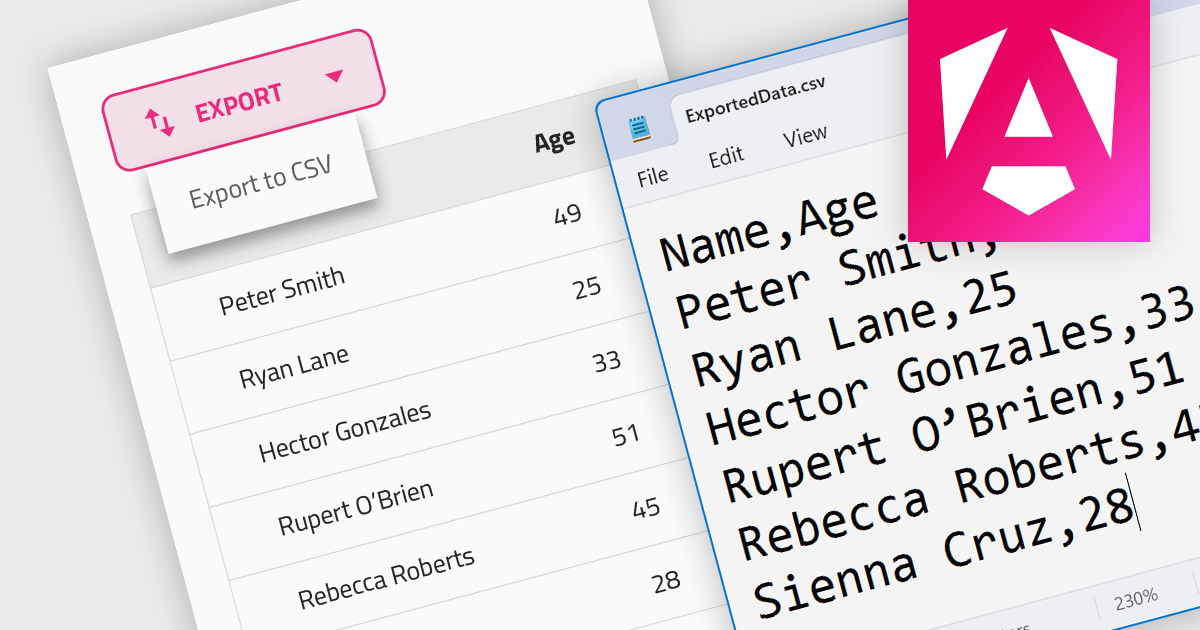
CSV export functionality in a grid control empowers users to seamlessly bridge the gap between interactive visualization and in-depth analysis. By exporting the displayed data as a readily importable CSV file, users gain immediate access to a familiar format compatible with diverse spreadsheet tools. This feature promotes efficient data extraction, facilitating further analysis, report generation, and data sharing, all directly from the convenience of the grid interface.
Several Angular grid controls support exporting to CSV, such as:
For an in-depth analysis of features and price, visit our Angular grid controls comparison.
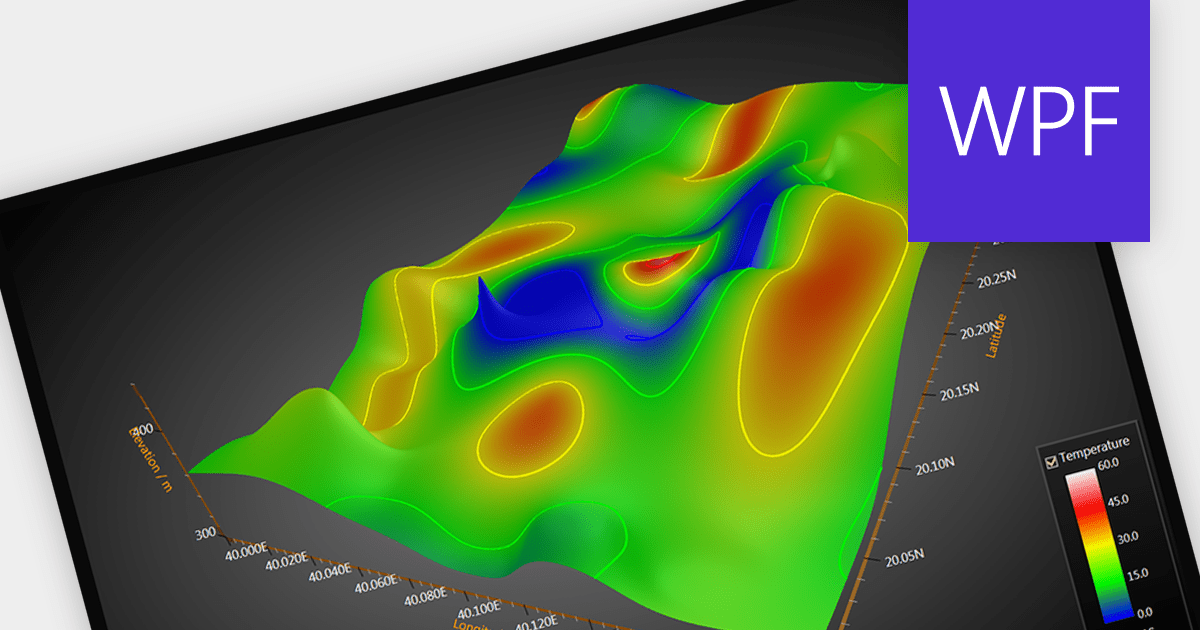
Surface charts are graphical representations that depict three-dimensional data in a two-dimensional format, typically using a grid of rows and columns. These charts provide a visual representation of how two independent variables (typically represented on the X and Y axes) influence a dependent variable, represented by the height or color of the surface. The primary benefit of surface charts lies in their ability to reveal complex relationships within datasets, making it easier for analysts and decision-makers to grasp patterns and trends. Surface charts offer a valuable tool for analyzing data in fields such as scientific research, engineering, finance, and various other domains.
Several WPF chart controls offer Surface charts including:
For an in-depth analysis of features and price, visit our WPF chart controls comparison.
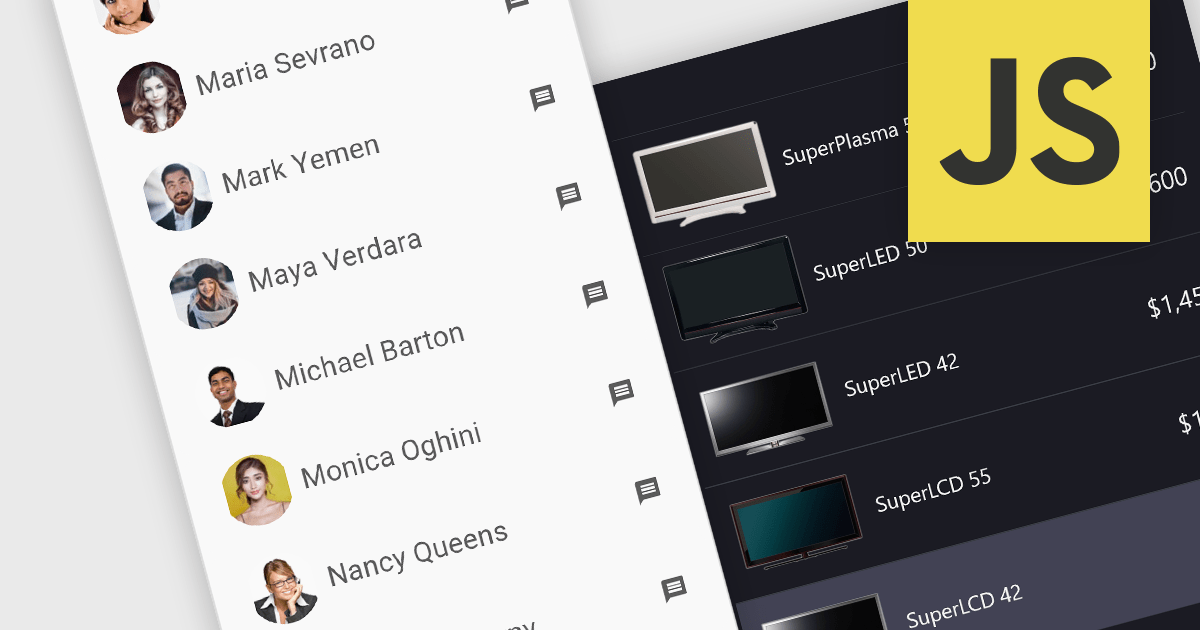
Image listboxes transcend the limitations of traditional listboxes by incorporating image previews alongside textual labels. This creates an intuitive browsing experience, enabling users to quickly identify and select an option with visual cues. This is particularly useful for applications where visual selection enhances the user experience, such as choosing products in an e-commerce platform or selecting avatars in user profiles. It combines the clarity of images with the efficiency of a listbox to streamline selection processes.
Several JavaScript data editor collections provide image listbox capabilities including:
For an in-depth analysis of features and price, visit our comparison of JavaScript Data Editor components.


Tél : (888) 850 9911
Fax : +1 770 250 6199


