


Fournisseur officiel
Comme nous somme les distributeurs officiels et autorisés, nous vous fournissons des licences légitimes directement à partir de 200+ éditeurs de logiciels.
Voyez toutes nos marques.
Devart ODBC Drivers are high-performance connectors that offer easy access to an array of database systems and cloud services. They boast extensive compatibility, advanced functionality like stored procedures and data encryption, and efficient data processing, empowering developers to work with live data across platforms (Windows, macOS, Linux) without relying on additional software or vendor libraries.
Devart has added six new ODBC Drivers to their product range. You can now connect seamlessly to Freshservice, SendGrid, Twilio, Shippo, SurveyMonkey, and QuickBooks Desktop from any application or programming language that supports the ODBC API.
The ODBC Drivers are licensed per developer and are available as an Annual or Perpetual License with a 12 month support and maintenance subscription. See our ODBC Driver licensing pages for Freshservice, SendGrid, Shippo, Twilio, SurveyMonkey, and Quickbooks Desktop.
For more information about the ODBC Drivers visit our product pages:
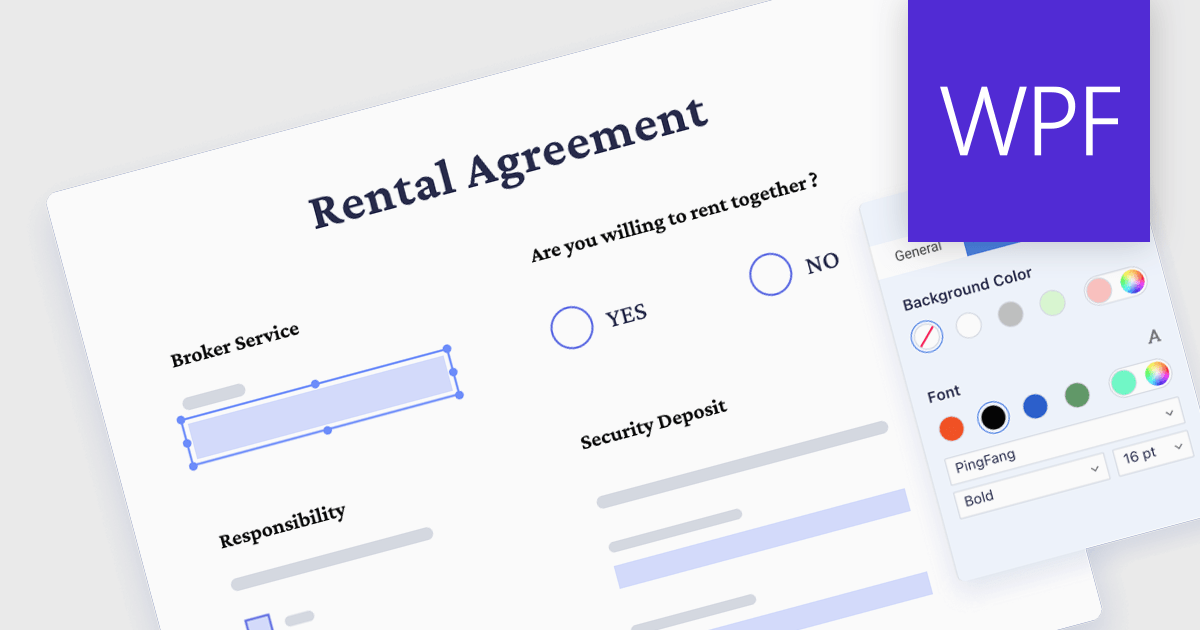
The ability to read, write and fill in form fields in PDFs allows users to directly interact with electronic forms embedded within PDF documents. This includes reading existing text in fields, entering new information, selecting options from checkboxes or dropdown menus, and even digitally signing completed forms. This functionality significantly streamlines workflows by saving time and effort compared to traditional paper forms, reducing printing and signing overhead, and enabling electronic storage and retrieval of filled forms.
Several PDF components for WPF support the reading and writing of form fields, including:
For an in-depth analysis of features and price, visit our WPF PDF Components comparison.
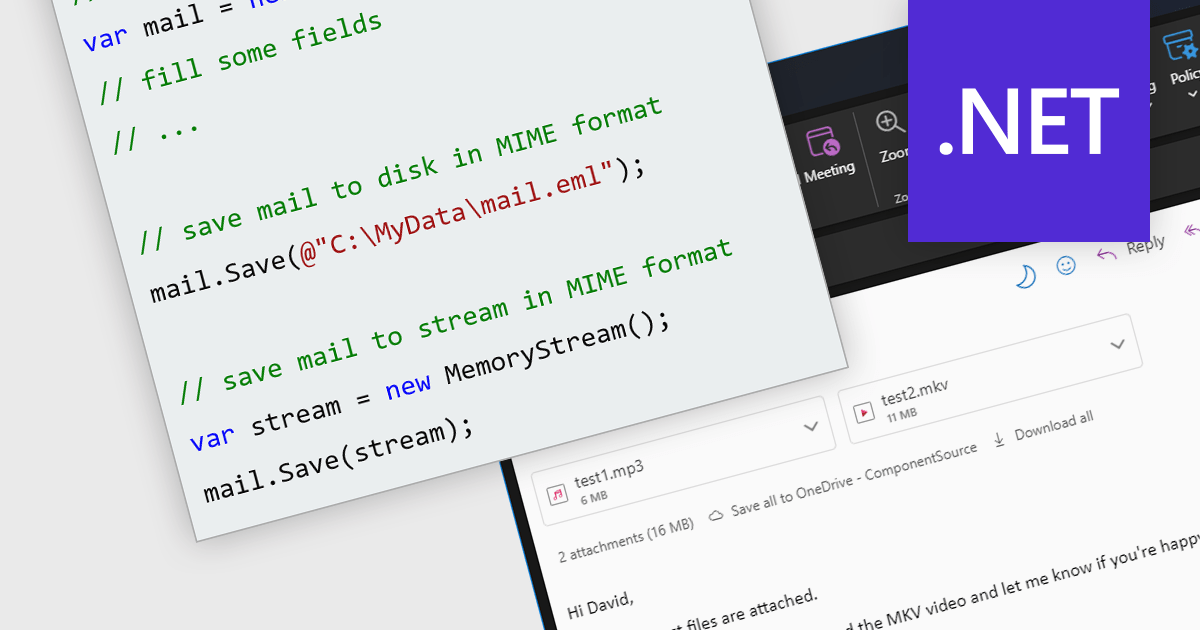
MIME (Multipurpose Internet Mail Extensions) enables the seamless exchange of diverse data beyond plain text. This industry standard acts as a bridge, allowing you to transmit rich content like images, videos and audio via email and other messaging platforms. Furthermore, MIME's multipart structure empowers the inclusion of multiple attachments within a single message, enhancing the efficiency and versatility of communication.
Several .NET comms and messaging components support the MIME format, including:
For an in-depth analysis of features and price, visit our .NET comms and messaging comparison.
Aspose.Cells for .NET is a robust programming library that empowers developers to manipulate, automate, and convert spreadsheets within their .NET applications. It eliminates dependence on Microsoft Excel while providing comprehensive control over data, formatting, charts, and even conversion to various file formats like PDF, JSON, and image formats, making it a powerful tool for streamlining spreadsheet-related tasks across platforms and environments.
The Aspose.Cells for .NET V24.1 release adds support for .NET 8. This allows developers to enjoy the performance boosts, enhanced cross-platform compatibility, and new APIs in the latest version of Microsoft's popular development framework.
To see a full list of what's new in Aspose.Cells for .NET 24.1, see our release notes.
Aspose.Cells for .NET is offered as Developer Small Business, Developer OEM, Site Small Business, and Site OEM licenses, catering to a range of business needs. Licenses are perpetual, and include 1 year of support and maintenance. Subscription renewals are also available. See our Aspose.Cells for .NET licensing page for full details.
Aspose.Cells for .NET is available to buy in the following products:
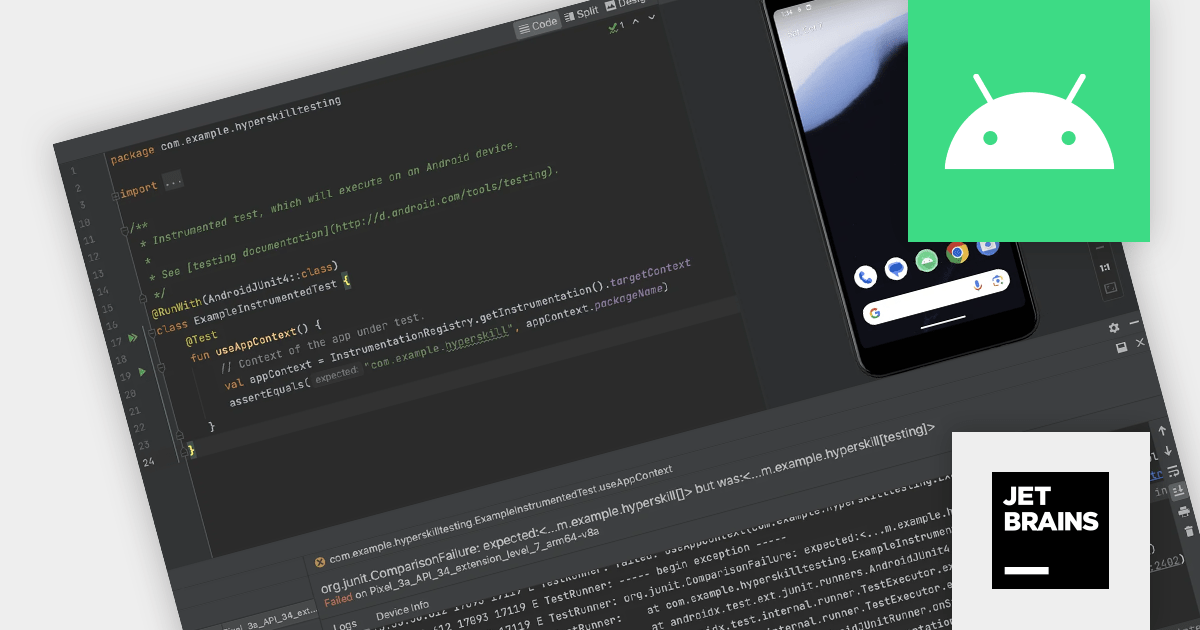
JetBrains Academy is an online educational platform designed to help developers advance their programming skills. It provides a holistic approach to learning in which users study the theory and immediately put it into practice by building working applications. The project-based learning environment is integrated with JetBrains IDEs, and allows developers to learn Java, Python, and other programming languages with ease.
The January 2024 release adds a new Android Studio testing topic. Testing forms the backbone of robust Android app development. By meticulously verifying code and app behavior through Android Studio's built-in tools and frameworks, you can detect and resolve issues before they impact users. This new topic delves into the various ways Android Studio empowers developers to ensure their app's quality and deliver a seamless user experience.
To see a full list of what's new, see our release notes.
JetBrains Academy is licensed per user as a commercial annual subscription. See our JetBrains Academy for Organizations licensing page for full details.
For more information, visit our JetBrains Academy for Organizations product page.


Tél : (888) 850 9911
Fax : +1 770 250 6199


