À propos de amCharts 5: Charts

Bibliothèque de programmation de graphiques JavaScript pour tous vos besoins en visualisation de données.

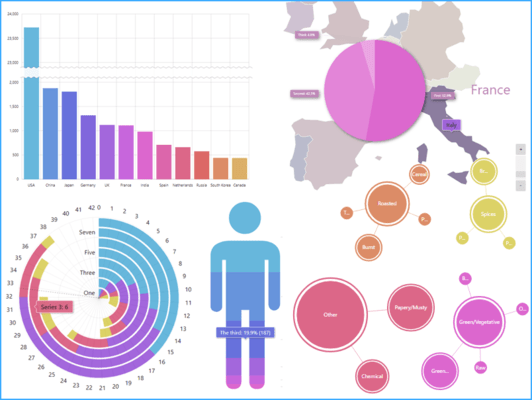
amCharts: Charts is a go-to library for data visualization. When you don’t have time to learn new technologies. When you need a simple yet powerful and flexible drop-in data visualization solution. amCharts is a ready-made JavaScript library that allows you to add interactive charts to a vast array of applications. With built-in support for TypeScript and ES6 modules, it is fully compatible with Angular, React, Vue.js as well as vanilla JavaScript applications.

amCharts 5: Charts Features

  • Canvas rendering - amCharts 5 uses the browser's Canvas API which in most cases is faster than SVG. Less moving parts in the DOM tree, faster rendering.
  • Layering - Common element groups are isolated into separate independent canvases, so that heavily updated sections do not trigger expensive repaints in places that do not change.
  • Fast data processing - Data processing in amCharts 5 is designed to be as efficient as possible. Incremental updates, lack of repetitive aggregations, and lightweight data object use makes data processing fast and very memory-efficient.
  • Faster dashboards - amCharts 5 is capable of running scores of charts on the same page, without crippling the browser, due to its lightweight approach to data parsing and rendering.
  • Tiny binaries - amCharts 5 has been made really small, the core functionality compiles to a file of only around 400KB. Each niche functionality is separated into files, so you load only what you really need.
  • Better tree-shaking - amCharts 5 has been designed to be extremely tree-shakable. If you are using Webpack or similar packager, only code that is really needed will be included into your final application.
  • Pictorials - Create multi-layer, multi-series pictorial charts. Any SVG path can be used as a shape for your chart.
  • Sankey Diagrams - Stunning flow diagrams, in horizontal and vertical, with draggable, fully configurable nodes.
  • Enhanced radar charts - With stacked column, bands, axes, and other enhancements, radar charts are now way more useful.
  • Treemaps - Completely zoomable, multi-level, highly configurable.
  • Heatmaps - Automatically build heat-maps, with custom axes, color ranges, and awesome new interactive Heat Legend. Create heatmaps using colors, or point size or both. Universal and flexible heat rules allow attaching any value in data to any property or properties on any element.
  • Chord diagrams - Visualize your 2-way relational data in a neat circular Chord diagrams. There are different variations of the classic diagram: Chord, Chord directed, and Chord non-ribbon.
  • Funnel charts
    • amCharts 5 offers Funnel charts. The slice's area size represents the value, so each step's influence on overall volume reduction is more prominent than with basic funnels.
    • Trapezoid form can also be configured to further emphasize reduction.
    • Complete it with other visual elements, like fully configurable slice lines, multiple series support, togglable legends, and many more options.
  • Powerful theme engine - amCharts 5 comes with several themes as well as a flexible theme engine, which you can use. A CSS-like rule-based theme targeting system has been created. Using, creating, customizing themes or standalone rules is now easier. The new system allows applying defaults to elements based on their type, features, or position in a virtual element tree.
  • Fresh new look - The default style has been designed to look fresh. Carefully selected color schemes and default settings have been specifically chosen to make the charts stand out.
  • Silk-smooth animations - Every setting - colors, positions, sizes, opacity, and many more - is animatable to ensure smooth transitions.

Supported Chart Types Include:

  • X/Y
    • Line & Smoothed line
    • Area & Range Area
    • Column & Bar (stacked or clustered)
    • Scatter & Bubble
    • Floating & Gantt
    • Waterfall
    • Error & Control
    • Stacked (regular or 100%)
    • Heatmap
    • Pareto Diagram
    • Bullet
    • Dumbbell Plot & Lollipop
    • Order Book / Depth
    • Stream & Process Control
    • Beeswarm
    • Mekko
    • Micro & Sparklines
    • and any combination of the above
  • Percent
    • Pie & Donut
    • Nested donut
    • Funnel
    • Pyramid
    • Pictorial
  • Other
    • Sankey diagram
    • Chord, Chord directed, and Chord non-ribbon diagrams
    • Pack
    • Treemap
    • Voronoi
    • Tree
    • Arc
    • Sunburst
    • Partition
    • Force-directed tree
    • Radar & Polar
    • Gauge
    • Radial Histogram & Heat Map
    • Flower & Wheel of Life
    • Word cloud & Sentence cloud
    • Venn diagram
    • Infographic
    • Violin Chart