Fornitore ufficiale
In qualità di distributori ufficiali e autorizzati, forniamo licenze software legittime direttamente da più di 200 autori di software.
Vedi tutte le nostre marche

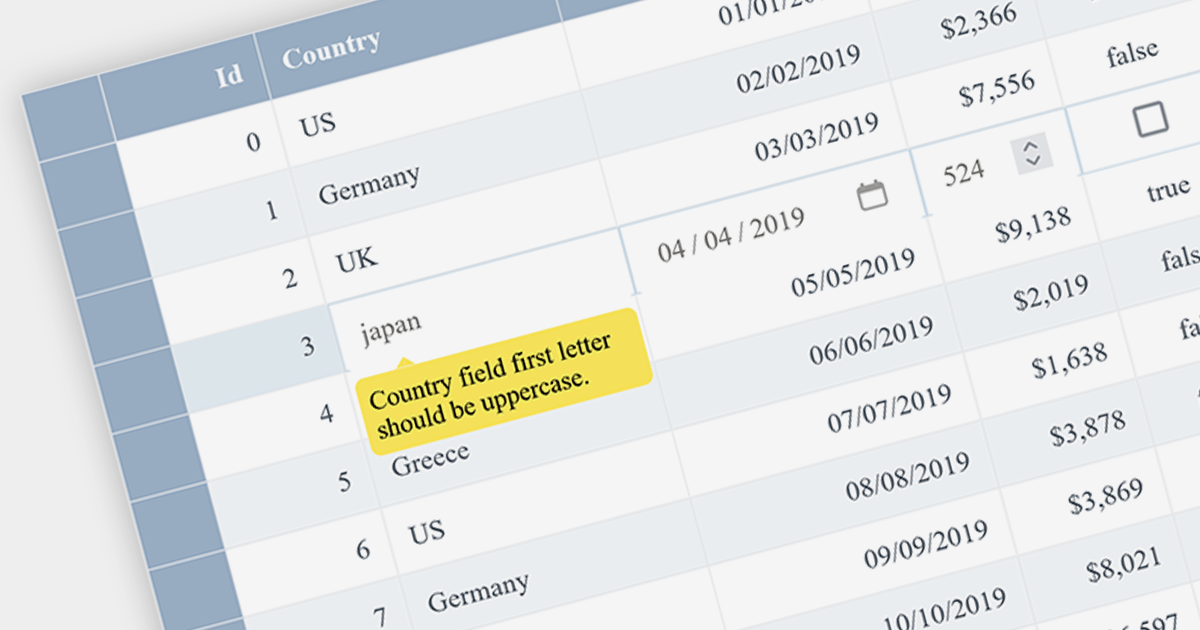
Data Validation ensures that input data meets certain criteria before it is accepted. This feature is crucial for maintaining data integrity and preventing user errors. For example, a grid might only allow date formats in a specific cell or prevent duplicate entries in a column, thereby enforcing data consistency.
Several Angular grid controls offer data validation support including:
Alternatively, many Angular grid controls are available as part of multi-function suites:
For an in-depth analysis of features and price, visit our comparison of Angular grids.

Infragistics Ignite UI for Angular is a comprehensive library of Angular-native UI controls and Material-based UI components, which includes a high-performance data grid and over 60 charts. Its WYSIWYG app builder helps you streamline your development process and deliver cutting-edge Angular solutions in a fraction of the time.
The 23.1 (17.0.0) release adds support for Angular 17, which offers enhanced performance through deferrable views, more intuitive syntax with built-in control flow, and accelerated builds for hybrid and client-side rendering.
To see a full list of what's new in version 23.1 (17.0.0), see our release notes.
For more information, visit our Infragistics Ignite UI for Angular product page.

amCharts 5: Stock Chart provides analytical tools for displaying time-based data, be it financial, stock or otherwise. It is a ready-made library that allows you to add interactive financial charts to a vast array of applications.
amCharts v5.5.3 adds built-in support for the Stochastic Momentum Index (SMI) to its bundled indicator control, allowing you to add the SMI to your charts via a simple user interface. This indicator reduces false signals by measuring the distance between the current closing price and the midpoint of the high/low price range. The SMI is a valuable technical indicator that can help traders identify potential trend reversals, capture momentum shifts, and make more informed trading decisions. Adding the SMI to your stock charts can help users gain a competitive edge in the market.
To see a full list of what's new in v5.5.3, see our release notes.
For more information, see our amCharts 5: Stock Chart product page.

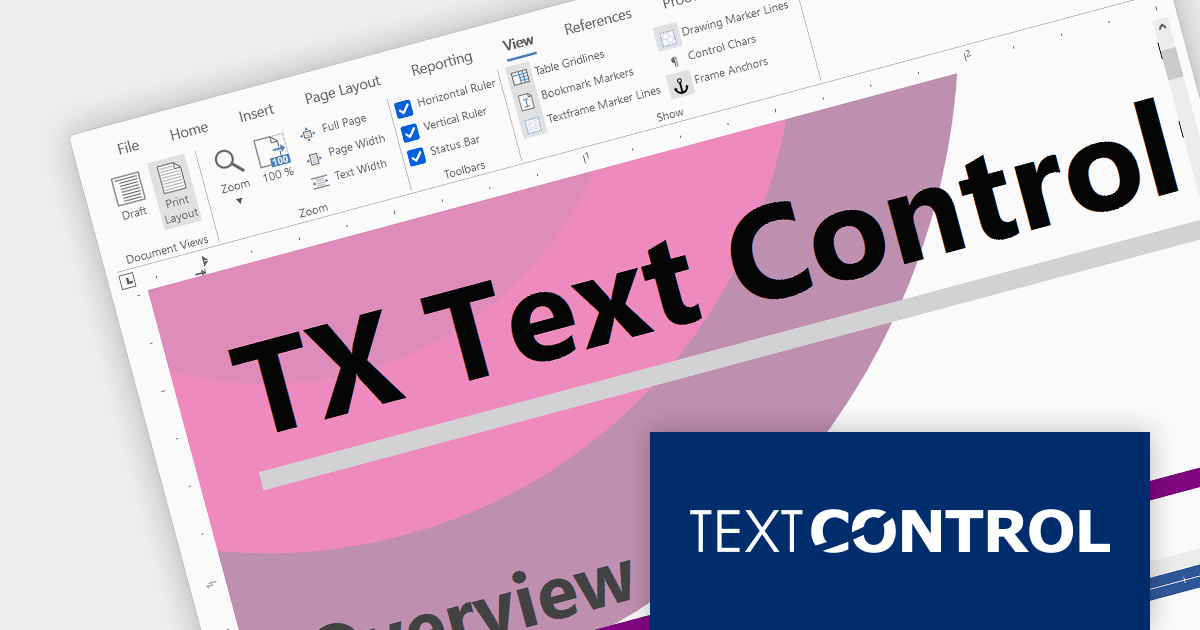
Text Control DS Server is an on-premise document services back-end for document processing. It includes a Microsoft Word compatible document editor, a lightweight document viewer, and a powerful document processing API.
Version 3.2.0 adds support for a new SVG rendering mode within the online document editor, improving performance in scenarios such as limited bandwidth or elevated ping times. By default the editor automatically determines the most suitable rendering method based on factors such as bandwidth availability.
To see a full list of what's new in version 3.2.0, see our release notes.
For more information, visit our Text Control DS Server product page.

LightningChart JS is a high-performance JavaScript charting library that utilizes WebGL rendering and GPU acceleration to deliver exceptional performance for a wide range of data visualization needs. It is designed to handle large datasets and complex visualizations with ease, enabling developers to create interactive and visually appealing charts for various applications.
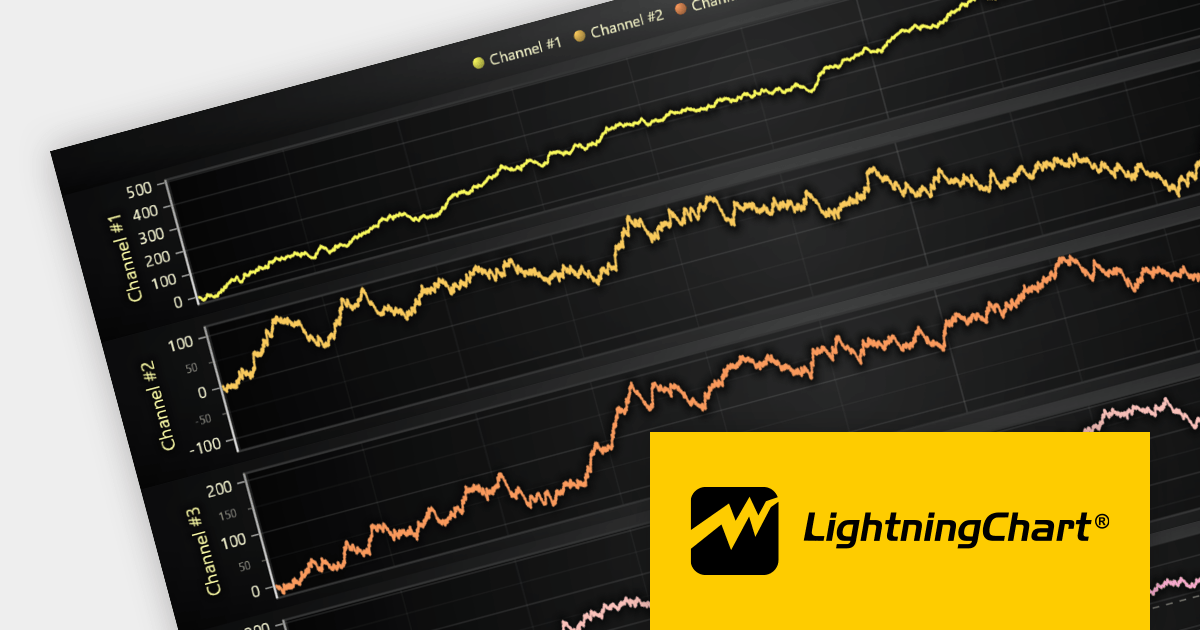
The LightningChart JS v5.0 release introduces WebGL context sharing, enabling the sharing of WebGL resources (e.g. textures, shaders, and buffers) across multiple WebGL contexts. This enhances the performance of multi-chart displays, minimizes memory consumption, and simplifies resource management. It optimizes the rendering of each chart, regardless of their arrangement or quantity. Developers can now employ HTML <div> elements to define chart layouts and use CSS for precise control over positioning.
To see a full list of what's new in v5.0.0, see our release notes.
For more information, see our LightningChart JS product page.