


Fornitore ufficiale
In qualità di distributori ufficiali e autorizzati, forniamo licenze software legittime direttamente da più di 200 autori di software.
Vedi tutte le nostre marche
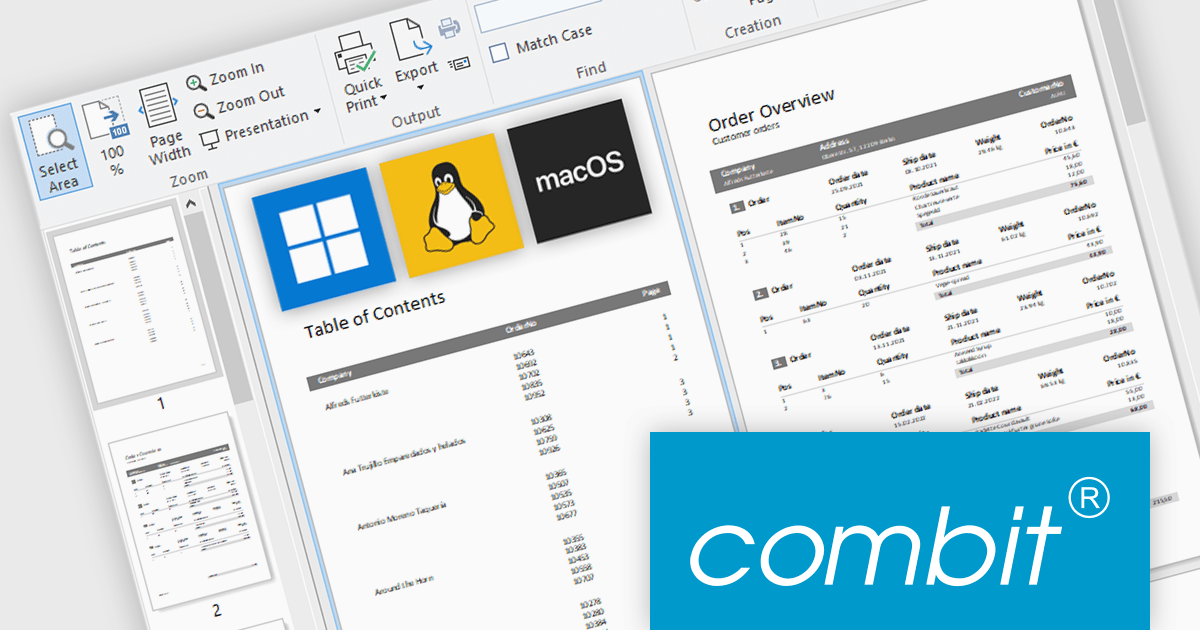
combit have announced an exciting new development for their popular report generator with the introduction of List & Label Cross Platform (LLCP), due for release in October.
This is a significant milestone for combit, as they will now offer a cross-platform reporting solution for Windows, Linux, and macOS. The new powerful print engine is entirely based on the most recent version of .NET, with no native dependencies. For reporting that runs anywhere your app runs.
Features will include:
This cross-platform functionality will only be included as part of the List & Label Enterprise Edition. To help customers benefit from this major advancement, special offers are available until October 9th 2025.
* Subscription terms for free upgrades will not be extended. Special discounted renewal options will be available until October 2026, please contact us for details.
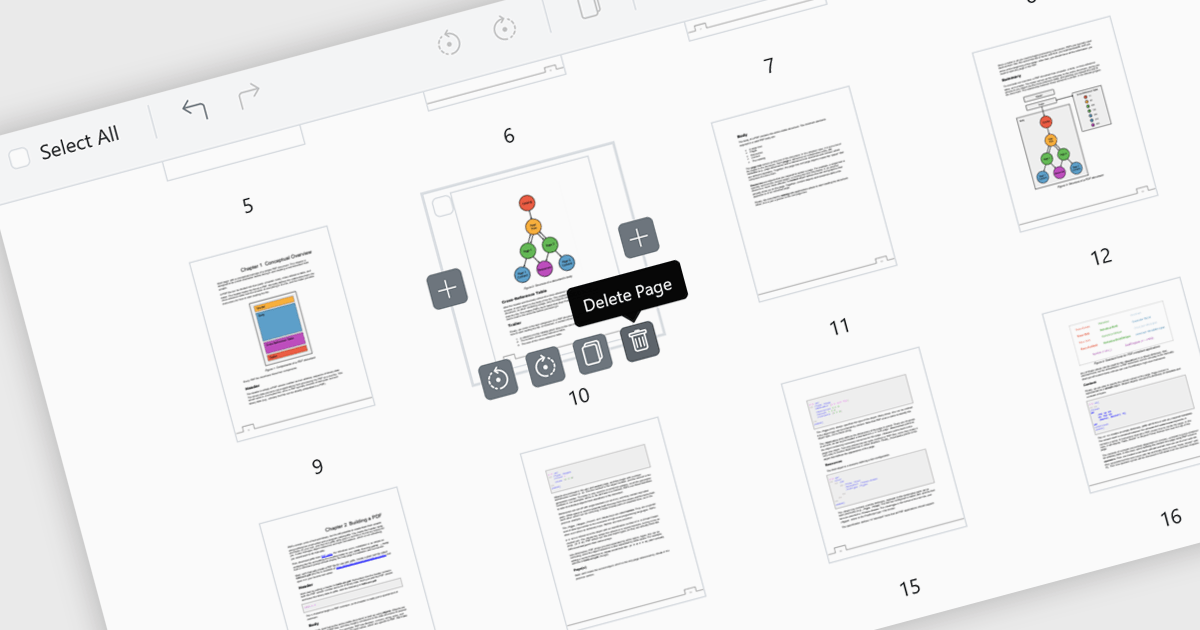
Page deletion in a PDF Viewer allows users to remove unwanted, duplicate, or sensitive pages directly within the application without needing a separate editor. This feature simplifies document management by reducing file size and ensuring the final PDF is clean, concise, and professional. It is particularly useful for correcting errors, such as removing mistakenly added or blank pages, as well as for enhancing security by deleting confidential content before sharing externally. By offering fast, built-in editing, page deletion improves productivity and makes tailoring documents to specific audiences more efficient.
Several ASP.NET Core PDF viewer controls offer the ability to add pages to a PDF file including:
For an in-depth analysis of features and price, visit our ASP.NET Core PDF viewer controls comparison.
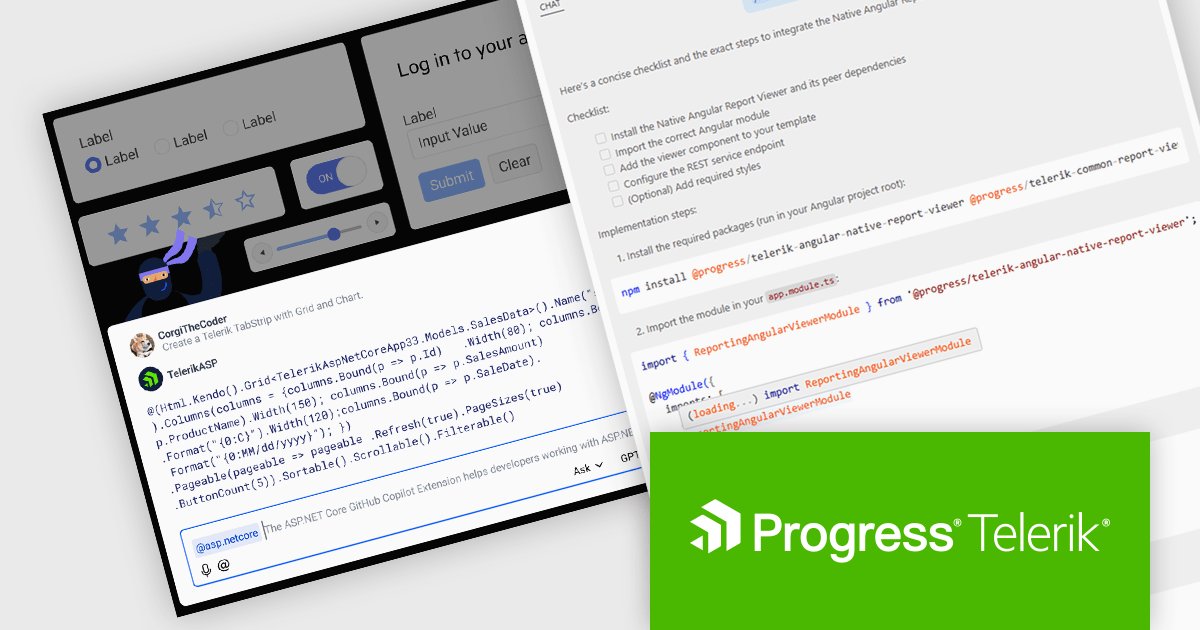
DevCraft by Telerik is a comprehensive suite of more than 1,250 UI components and development tools designed for building modern web, desktop, and mobile applications using .NET and JavaScript frameworks. It includes reporting and report management solutions, automated testing and mocking tools, and document processing libraries, as well as a wide range of professionally designed user interface controls from the Telerik and Kendo UI suites. DevCraft enables developers to create feature-rich, high-performance applications with consistent design and user experience, delivering enterprise-level, scalable, and maintainable software solutions.
The Telerik DevCraft 2025 Q3 update extends the availability of the AI coding assistants to all of the major UI libraries. Along side Blazor and React, the AI Coding Assistant is now trained on and available for Kendo UI for Angular, Telerik UI for ASP.NET Core, UI for WPF, UI for WinForms and UI for .NET MAUI, as well as for Telerik Reporting and the Document Processing Libraries. These assistants are GitHub Copilot add-ins and MCP servers that provide context-aware and specialized AI-generated code directly in your IDE using natural language prompts, allowing developers to deliver high quality user interfaces and reporting functionality in web and desktop applications in much less time.
To see a full list of what's new in version 2025 Q3, see our release notes.
Telerik DevCraft is licensed per developer and has two licensing models: an annual Subscription License and a Perpetual License. The Subscription license provides access to the latest product updates, technical support, and exclusive benefits for a flat annual fee, and must be renewed to continue using the software. The Perpetual license is a one-time purchase granting access to the current released version and includes a one-year subscription for product updates and technical support. After this initial period, users can choose to renew the subscription element to continue receiving updates and support; otherwise, they may continue using the installed version available during their active subscription term but will forgo future updates and support. See our Telerik DevCraft Ultimate licensing page for full details.
Telerik DevCraft is available in the following editions:
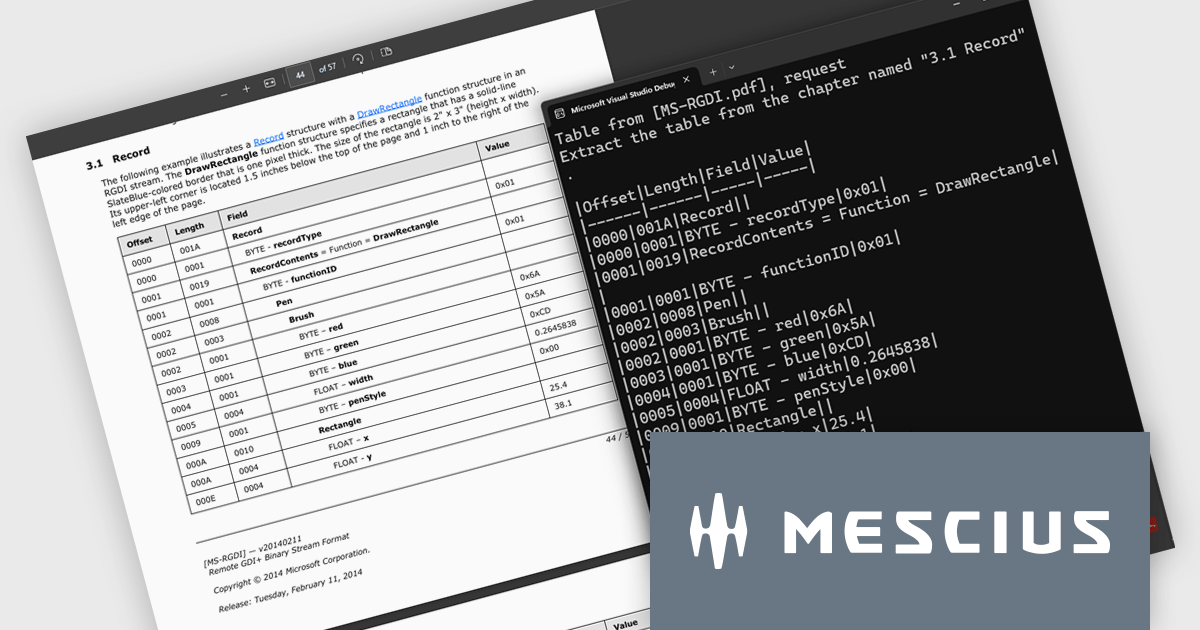
Document Solutions for PDF (DsPdf) by MESCIUS is a software development toolkit that provides .NET Core libraries and a JavaScript PDF viewer for manipulating and displaying PDFs. DsPdf enables developers to create, edit, annotate, and redact PDF documents directly within web applications. The included DsPdfViewer component offers a feature-rich, cross-platform solution for viewing and interacting with PDFs in modern browsers on various operating systems, including mobile devices.
The Document Solutions for PDF v8.2 update introduces a new AI-powered capability to extract tables from documents, enabling developers to convert unstructured tabular data in PDFs into structured, machine-readable formats with ease. By leveraging natural language prompts through OpenAI or Azure OpenAI services, this feature eliminates the need for manual parsing or coordinate-based extraction, reducing development effort. It provides reliable output even from PDFs with complex layouts or inconsistent formatting.
To see a full list of what's new in version 8.2, see our release notes.
Document Solutions for PDF is licensed per developer and is available in several license options for differing distribution needs. Team licenses are also available for multiple developers within the same organization. See our Document Solutions for PDF licensing page for full details.
Document Solutions for PDF is available to buy individually or as part of Document Solutions .NET Bundle.
Spreadsheet components in modern UI frameworks offer robust capabilities for exporting and printing data, enabling users to take structured, interactive grid content and transform it into static or sharable formats. These features are crucial in enterprise applications, where end users often need to generate reports, export analysis results, or share datasets in widely recognized formats. Whether integrated into financial dashboards, inventory systems, or business intelligence tools, export and print functionalities ensure that grid data remains portable, consistent, and accessible across various workflows and platforms.
Common features include:
For an in-depth analysis of features and price, visit our ASP.NET Core spreadsheet components comparison.


Tel: (888) 850 9911
Fax: +1 770 250 6199


