








Fornitore ufficiale
In qualità di distributori ufficiali e autorizzati, forniamo licenze software legittime direttamente da più di 200 autori di software.
Vedi tutte le nostre marche
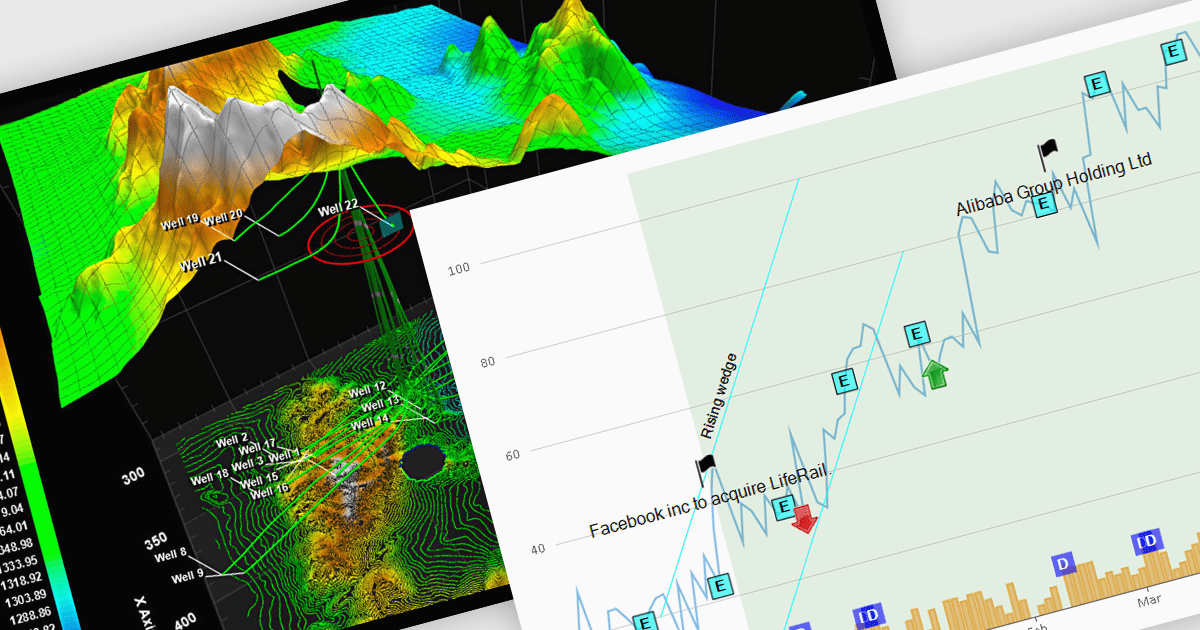
Annotations in a chart refer to additional textual or graphical elements overlaid onto the visual representation of data. They serve to provide context, explanations, or highlights within the chart, making it easier to understand. Software developers can utilize annotations to label specific data points, mark significant events, or add explanatory notes, thereby improving the clarity and insightfulness of the chart for end-users. By incorporating annotations, developers can effectively convey complex information, facilitate better data comprehension, and enable more informed decision-making processes within their applications.
Several WPF chart controls support annotations including:
Many WPF suites contain chart controls with annotation support including:
For an in-depth analysis of features and price, visit our comparison of WPF Chart Controls.
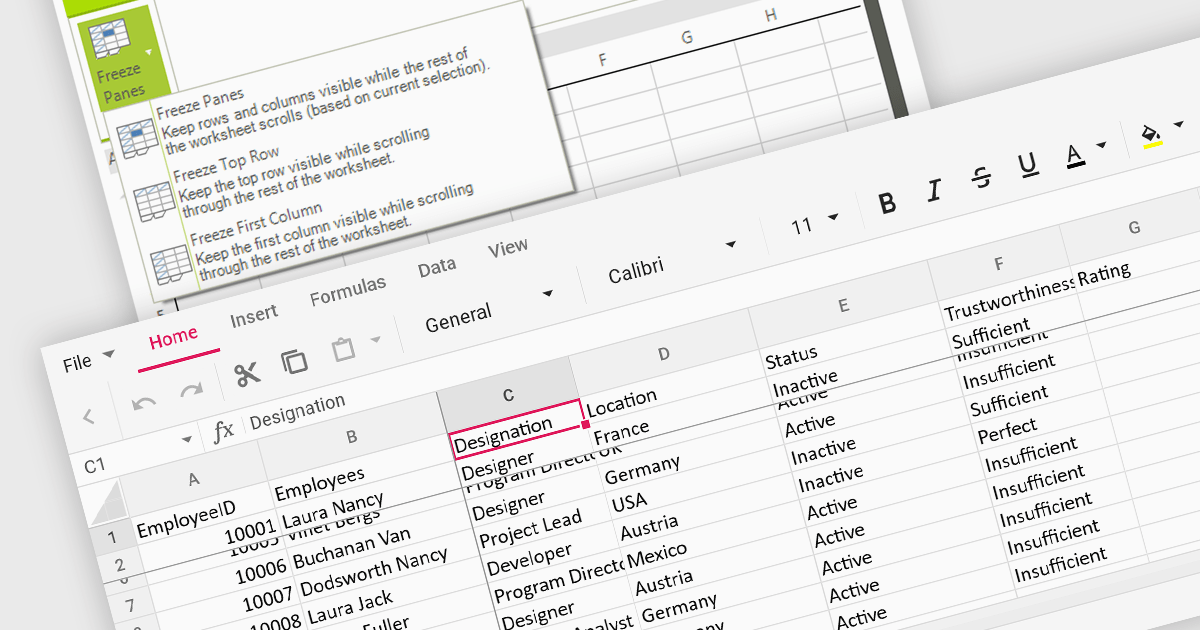
Freeze pane support allows you to fix specific rows or columns in place while scrolling through the rest of the data. This is particularly useful for large spreadsheets with header rows or key columns you need to reference constantly. By freezing panes, you ensure these crucial elements remain visible even as you navigate across vast datasets, improving readability and data analysis efficiency.
Several WinForms spreadsheet controls offer freeze pane support including:
For an in-depth analysis of features and price, visit our WinForms spreadsheet controls comparison.

LightningChart .NET is a 2D and 3D data visualization SDK empowering developers with high-performance and flexibility. Boasting over 100 chart types, advanced technical indicators, and real-time rendering capabilities, it handles demanding scientific, financial, and engineering challenges, while its rich API and comprehensive support equip developers to craft informative and interactive dashboards.
The LightningChart .NET v11.0.1.1 release enhances text rendering fidelity in WinForms applications, ensuring exceptional clarity and readability across diverse screen resolutions and DPI configurations. This update guarantees a visually consistent and crisp user experience, independent of the user's device display characteristics. Additionally, it optimizes per-monitor DPI awareness for text rendering in both WinForms and WPF applications, particularly within the .NET 6 build environment. This refinement assures well-rendered and accurately scaled text across multiple monitors with varying DPI settings.
To see a full list of what's new in v11.0.1.1, see our release notes.
LightningChart .NET is available per developer in packages for either WPF, WinForms, UWP or all 3. Each package comes as a subscription license (with 1 or 2 years of limited support), or a perpetual license (with 1 or 2 years of Standard or Premium support). Floating licenses and site licenses are available upon request. See our LightningChart .NET licensing page for full details.
For more information, see our LightningChart .NET product page.
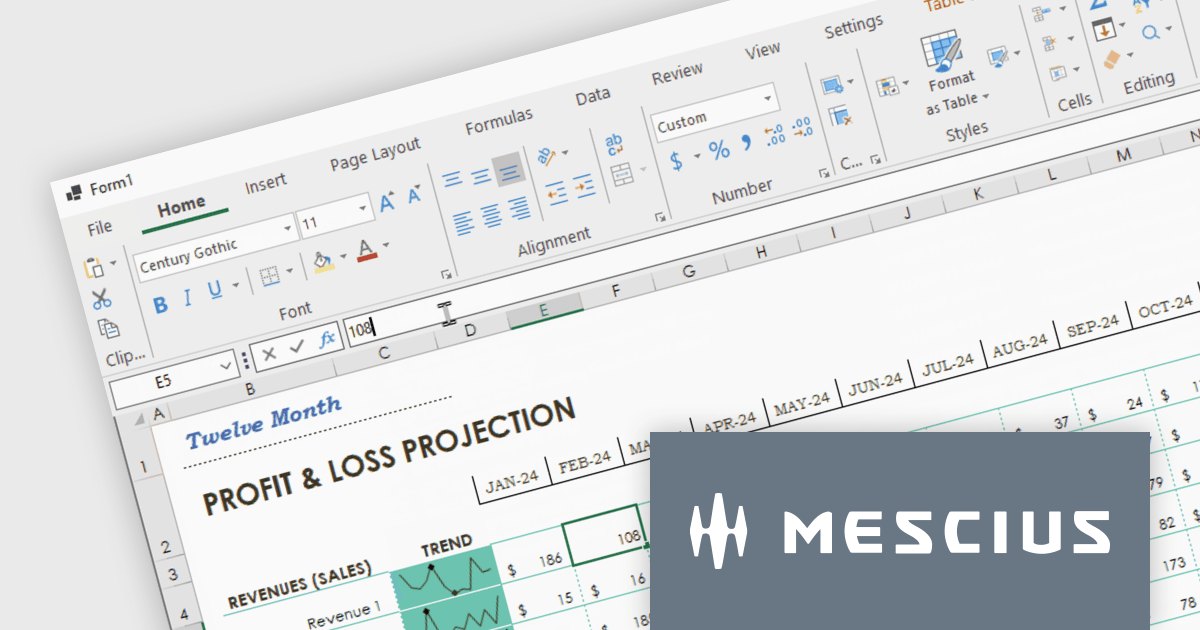
Spread.NET helps you create spreadsheets, grids, dashboards, and forms. It includes a powerful calculation engine with 450+ functions and the ability to import and export Excel spreadsheets. Leverage the extensive .NET spreadsheet API and powerful calculation engine to create analysis, budgeting, dashboard, data collection and management, scientific, and financial applications. You can develop in Visual Studio using VB or C# for WinForms, ASP.NET, and WPF. Spread.NET ensures maximum performance for your enterprise apps and its modular architecture lets you add only the features you need, reducing unnecessary bloat.
In this blog post, MESCIUS Product Marketing Specialist Mackenzie Albitz shows you how to add a spreadsheet ribbon bar control to a .NET 8 WinForms app using C#. Steps include:
Read the complete blog and unlock the powerful capabilities of the Spread.NET component.
Spread.NET is licensed per developer and is available as a Perpetual License with a 12 month support and maintenance subscription. We can supply any Spread.NET license including new licenses, maintenance renewals, and upgrade licenses. See our Spread.NET licensing page for full details.
For more information, visit our Spread.NET product page.
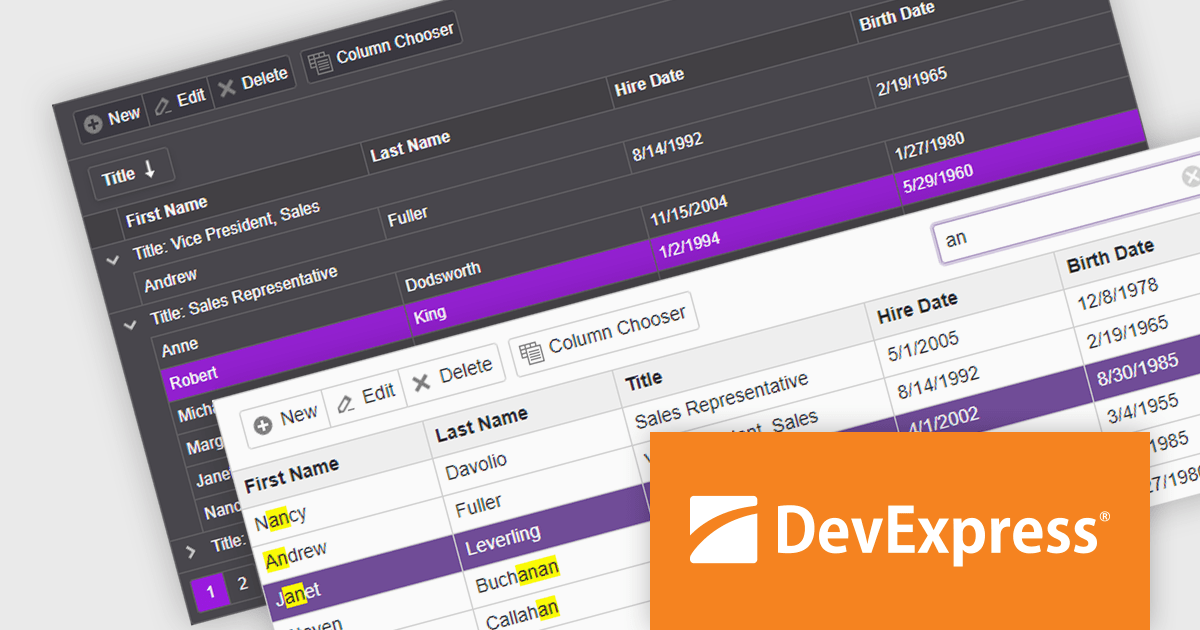
DevExpress ASP.NET and Blazor includes 110+ UI controls for ASP.NET (including Reporting), server-side MVC extensions or client-side controls with everything you need to build Office-inspired applications, over 70 high-performance ASP.NET Core UI controls, ASP.NET Bootstrap Controls for Office-inspired and Data Visualization apps, Blazor Components (including a Data Grid and Pivot Grid) so you can design rich user experiences for both server-side (Razor Components) and client-side (Blazor) platforms and the DevExtreme JavaScript component suite for responsive web development.
The DevExpress Blazor Grid UI component includes a new toolbar section for displaying custom content. In this blog post, DevExpress's Svetlana Mikheeva describes how to use this powerful component to create rich UIs displaying icons, text, or both. Steps include:
Read the complete blog and get started creating rich Blazor Grid applications.
DevExpress ASP.NET and Blazor is licensed per developer and includes a 12 month subscription for minor and major updates. Subscription renewals are also available. See our DevExpress ASP.NET and Blazor licensing page for full details.
Learn more about DevExpress ASP.NET and Blazor.





Tel: (888) 850 9911
Fax: +1 770 250 6199


