


Fornitore ufficiale
In qualità di distributori ufficiali e autorizzati, forniamo licenze software legittime direttamente da più di 200 autori di software.
Vedi tutte le nostre marche

Stimulsoft Reports.JS provides a robust reporting toolkit designed specifically for JavaScript applications. This library leverages a client-side architecture, offering a pure JavaScript report engine for efficient report rendering directly within web browsers. The solution includes a user-friendly report designer for building reports with various data sources and visualizations, along with a report viewer for seamless integration and display within your JavaScript applications. This eliminates the need for server-side dependencies or browser plugins, simplifying the development process for embedding powerful reporting functionalities into your web projects.
The Stimulsoft Reports.JS 2025.2.1 update introduces support for the Macro PDF417 barcode, allowing developers to handle larger data payloads within reports. Unlike the standard PDF417 barcode, which is limited in data capacity, the Macro PDF417 format enables the encoding of large data files by splitting them into multiple linked symbols. This enhancement is particularly useful when working with high-volume or multi-page reports, providing a reliable solution for encoding structured data without compromising layout or readability.
To see a full list of what's new in 2025.2.1, see our release notes.
Stimulsoft Reports.JS is licensed per developer and is available as a Perpetual license with 1 year support and maintenance. See our Stimulsoft Reports.JS licensing page for full details.
Stimulsoft Reports.JS is available individually or as part of Stimulsoft Ultimate.
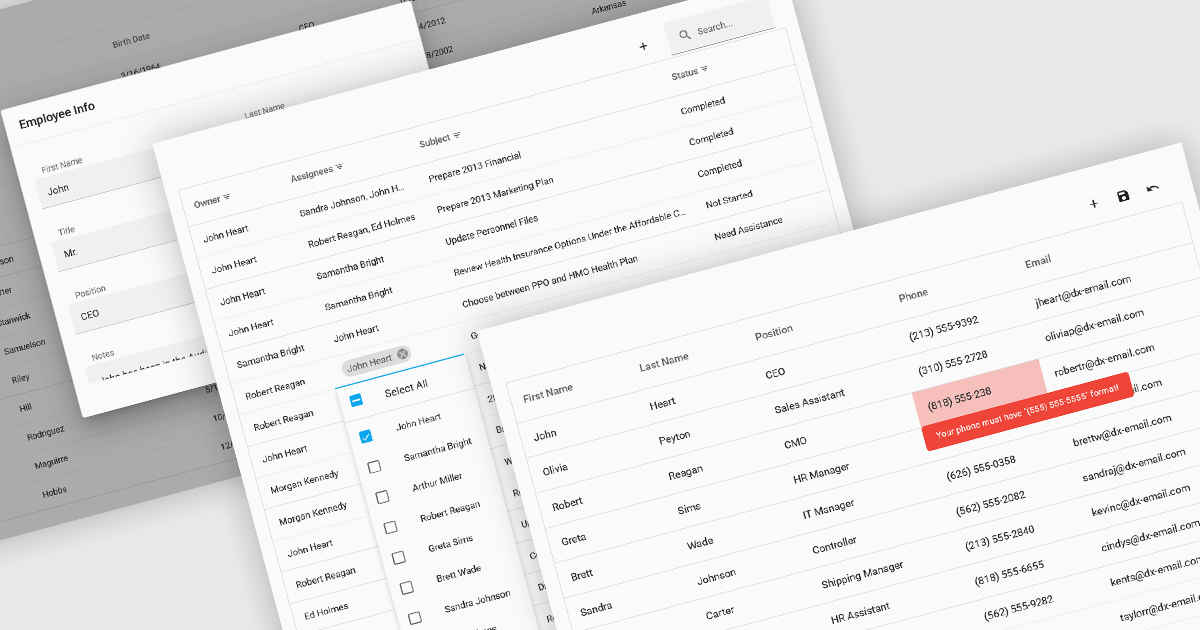
Data interaction and manipulation features in grid components enable users to engage directly with tabular data—supporting not just the display of information, but also its editing, validation, and contextual input. These capabilities are critical for creating rich, form-like experiences within data grids, particularly in applications where user input and data integrity are central to the workflow. By offering a range of editing modes and validation tools, grid components help ensure that data remains both accessible and accurate, enabling intuitive and efficient user interactions.
Common grid editing and validation features include:
For an in-depth analysis of features and price, visit our React grid components comparison.
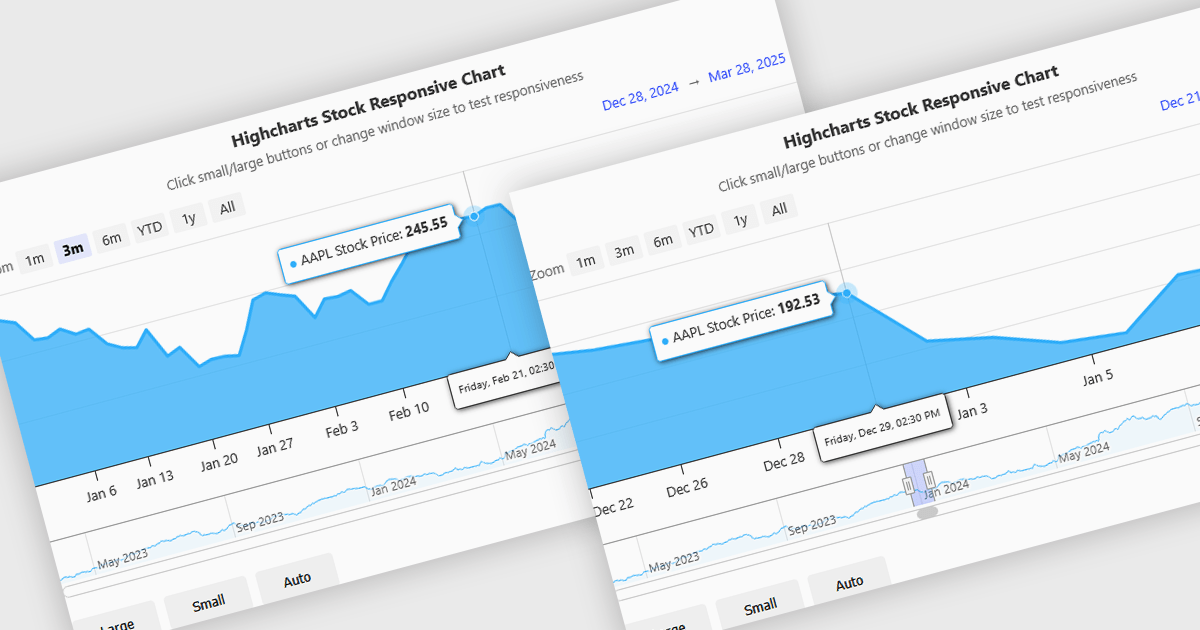
Responsive behavior in chart controls refers to the automatic adjustment of a chart’s layout, dimensions, and visual elements to fit the screen size or container in which it is rendered. This functionality ensures that charts remain readable and usable across a wide range of devices, from desktops to tablets and smartphones, without requiring manual configuration for each format. The benefits include reduced development overhead, improved user experience, and consistent presentation of data regardless of platform. Common use cases include dashboards in web applications, analytics platforms, and mobile-first reporting tools, where users expect seamless interaction and clear data visualization across multiple device types.
Several JavaScript chart controls support responsive behavior, including:
For an in-depth analysis of features and price, visit our JavaScript chart controls comparison.
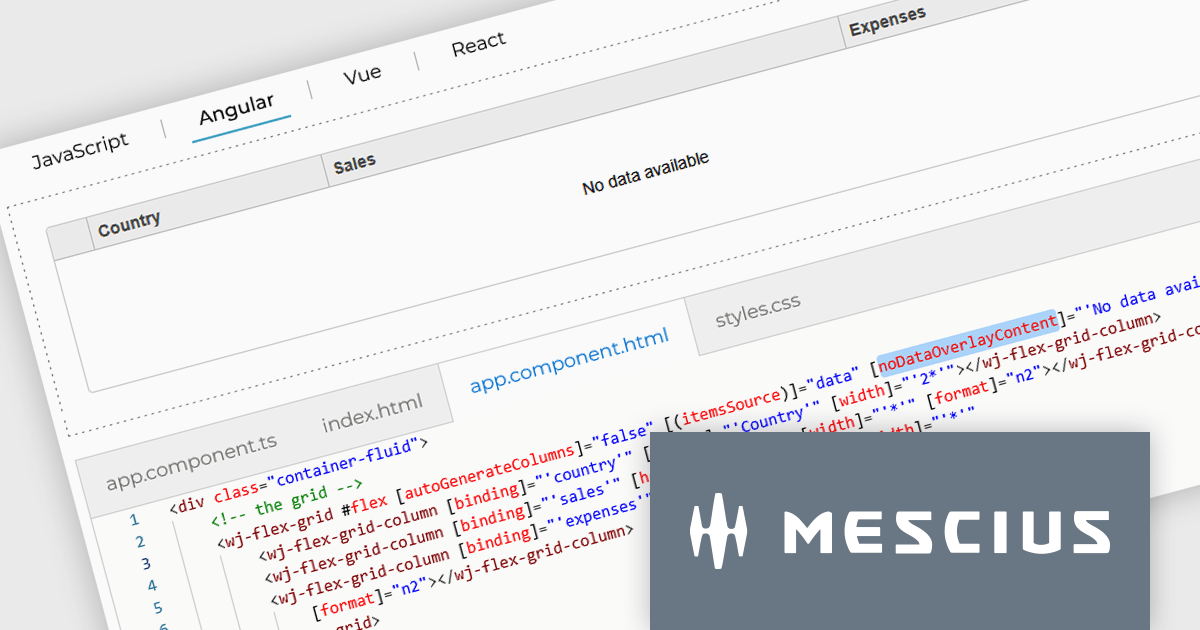
Wijmo by MESCIUS is a comprehensive JavaScript library offering a suite of high-performance UI components and data grids specifically designed to streamline the development of modern enterprise applications. It emphasizes reduced development time and improved maintainability, along with a focus on performance through its efficient design and small module size. Wijmo integrates seamlessly with popular JavaScript frameworks like Angular, React, and Vue.js, and supports cutting-edge technologies like TypeScript, making it a versatile solution for building complex web applications.
The Wijmo 2025 v1 update introduces a customizable noDataOverlayContent property, enabling developers to display tailored HTML messages when grid data is empty. This improves user experience by replacing blank grid views with informative content, while the new overlayManager allows advanced control over how overlays are rendered and managed. The release also expands framework support, adding compatibility with Angular 19 and Next.js 15 to help developers stay current with modern web development tools.
To see a full list of what's new in 2025 v1 (Build 5.20251.34), see our release notes.
Wijmo is licensed per developer. Developer Licenses are perpetual and include 1 year Subscription which provides upgrades, including bug fixes and new features. See our Wijmo licensing page for full details.
Learn more on our Wijmo product page.
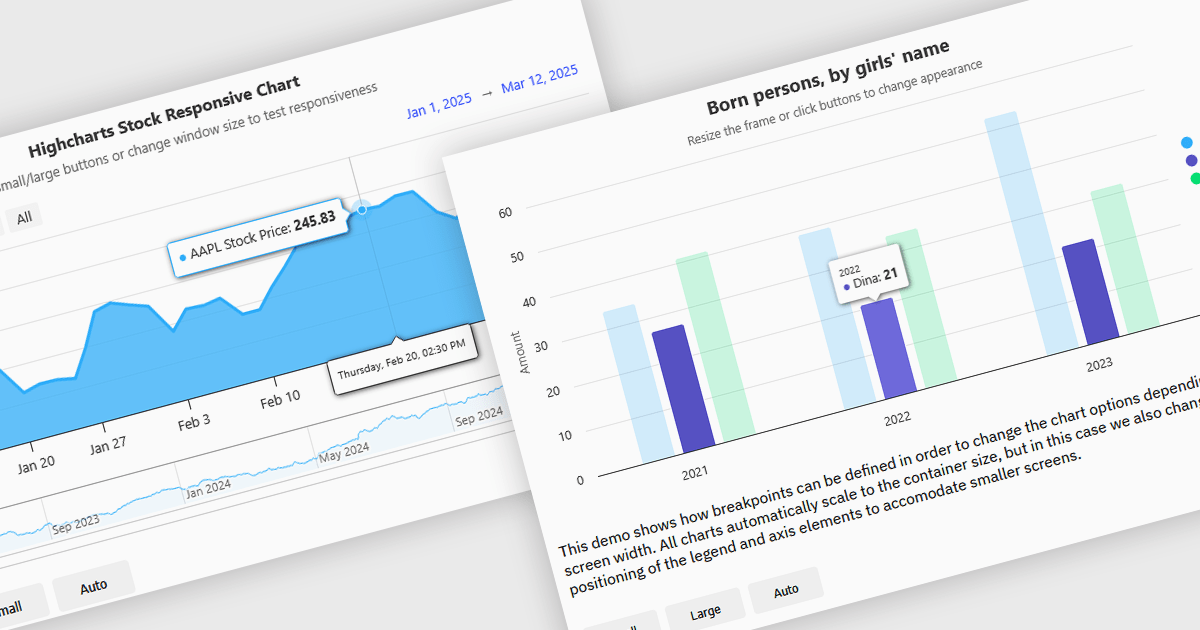
Responsive charts are dynamic data visualizations that automatically adjust to different screen sizes, resolutions, and devices, ensuring a seamless user experience across desktops, tablets, and mobile phones. By adapting elements such as labels, tooltips, legends, and axes, they enhance readability, improve accessibility, and maintain consistent data presentation. These charts optimize performance by efficiently rendering content and supporting interactive features like zooming, panning, and touch gestures. Developers use responsive charts in a wide range of applications, including financial reports, business intelligence dashboards, real-time monitoring systems, and interactive analytics tools, providing users with clear and accessible insights regardless of their device.
Several React charts offer responsive chart support, including:
For an in-depth analysis of features and price, visit our React chart comparison.


Tel: (888) 850 9911
Fax: +1 770 250 6199


