


Fornitore ufficiale
In qualità di distributori ufficiali e autorizzati, forniamo licenze software legittime direttamente da più di 200 autori di software.
Vedi tutte le nostre marche
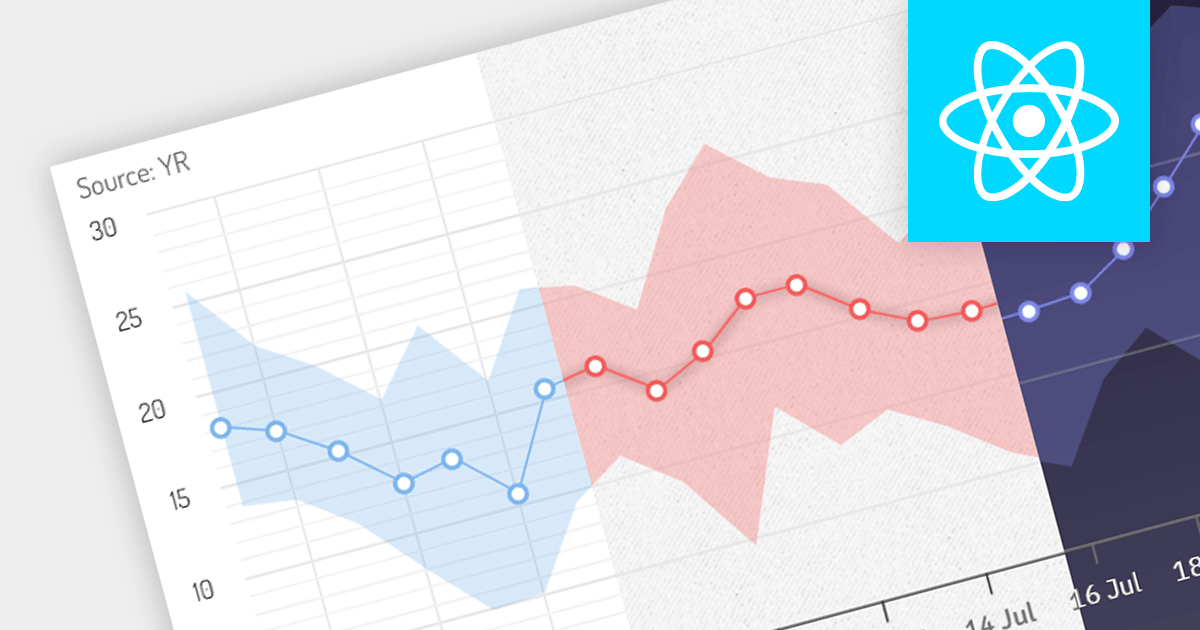
Theming gives users the ability to change the appearance of chart controls to match the overall look and feel of your application. This can include changing the colors, fonts, and styles of chart elements. Themes help to ensure that your charts have a consistent style, making your application more visually appealing.
Several React charting components offer the ability to add themes, here are some notable options:
Additionally, there are charting components available as part of larger component suites:
For an in-depth analysis of features and price, visit our comparison of React charts.
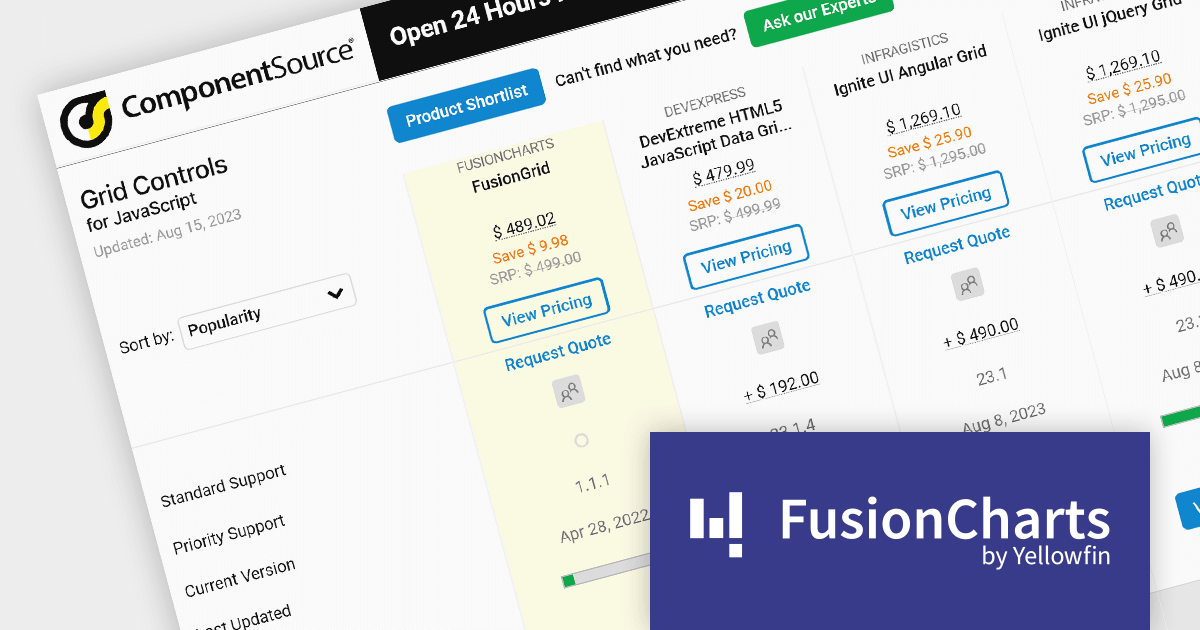
As the premier marketplace for software components and development tools, we are pleased to announce the addition of FusionGrid by FusionCharts to our JavaScript Grids Comparison. This latest inclusion further enriches the comparison tool's offerings, providing developers with a wider selection of high-performance grid components for their JavaScript projects.
FusionGrid is a customizable JavaScript data grid component developed by the team behind FusionCharts. It is designed for both Web and mobile applications, and allows you to build grids in dashboards with the same simplicity as FusionCharts. FusionGrid can be easily integrated with JavaScript front-end frameworks, such as Angular, React, and Vue.
FusionGrid is easy to use and customize, and has a well-documented API with numerous resources to help developers get started.
Our updated JavaScript Grids Comparison enables developers to evaluate FusionGrid with over 20 other popular grid components. It provides an in-depth analysis of each control's features, including supported cell types, export formats, data sources, and JavaScript framework support, as well as pricing and community reviews. With extensive sorting and filtering options, our comparison makes it easy to shortlist products and find the best grid control for your JavaScript project.
By incorporating FusionGrid into the comparison, we continue to ensure that developers have access to a comprehensive overview of the best grid components available in the market. This empowers developers to make informed decisions based on their specific requirements, ultimately saving time and effort in the selection process.
For an in-depth analysis of features and price, visit our comparison of JavaScript grids.


Tel: (888) 850 9911
Fax: +1 770 250 6199


