


Fornitore ufficiale
In qualità di distributori ufficiali e autorizzati, forniamo licenze software legittime direttamente da più di 200 autori di software.
Vedi tutte le nostre marche
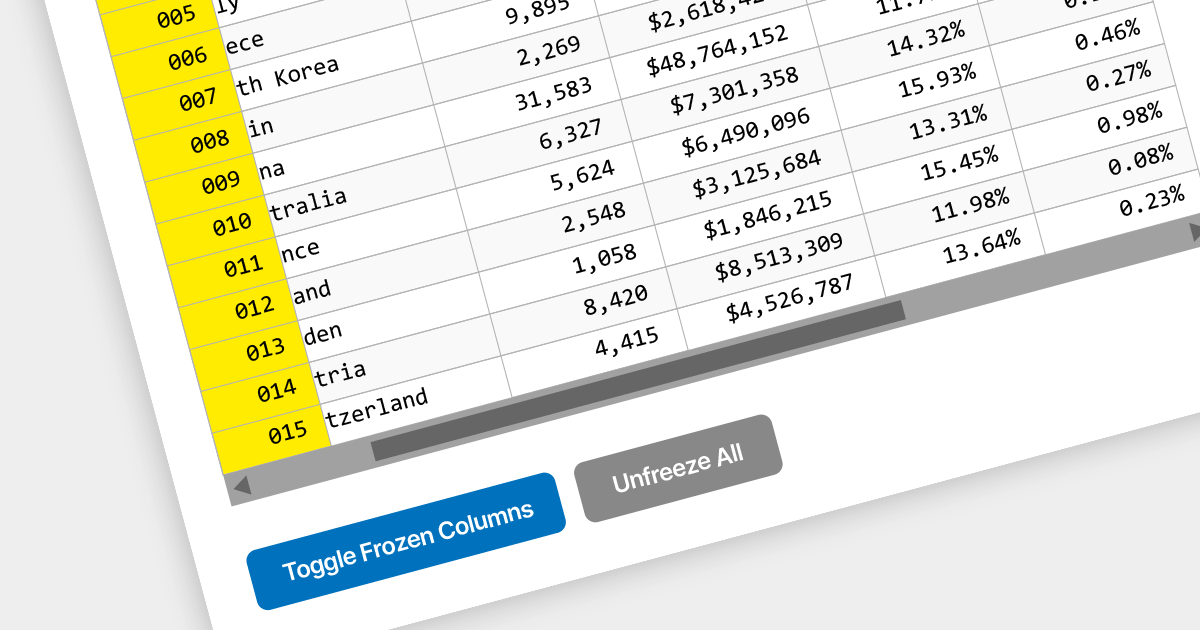
Locked column functionality (also known as frozen or pinned column) allows users to keep one or more columns static while scrolling horizontally through a grid. This is an essential feature for comparing data across a wide grid, ensuring that key information, such as a row identifier column, remains in view.
Several React grid components offer column freezing functionality including:
For an in-depth analysis of features and price, visit our comparison of React Grid components.

amCharts 5: Stock Chart provides analytical tools for displaying time-based data, be it financial, stock or otherwise. It is a ready-made library that allows you to add interactive financial charts to a vast array of applications.
amCharts v5.5.3 adds built-in support for the Stochastic Momentum Index (SMI) to its bundled indicator control, allowing you to add the SMI to your charts via a simple user interface. This indicator reduces false signals by measuring the distance between the current closing price and the midpoint of the high/low price range. The SMI is a valuable technical indicator that can help traders identify potential trend reversals, capture momentum shifts, and make more informed trading decisions. Adding the SMI to your stock charts can help users gain a competitive edge in the market.
To see a full list of what's new in v5.5.3, see our release notes.
For more information, see our amCharts 5: Stock Chart product page.
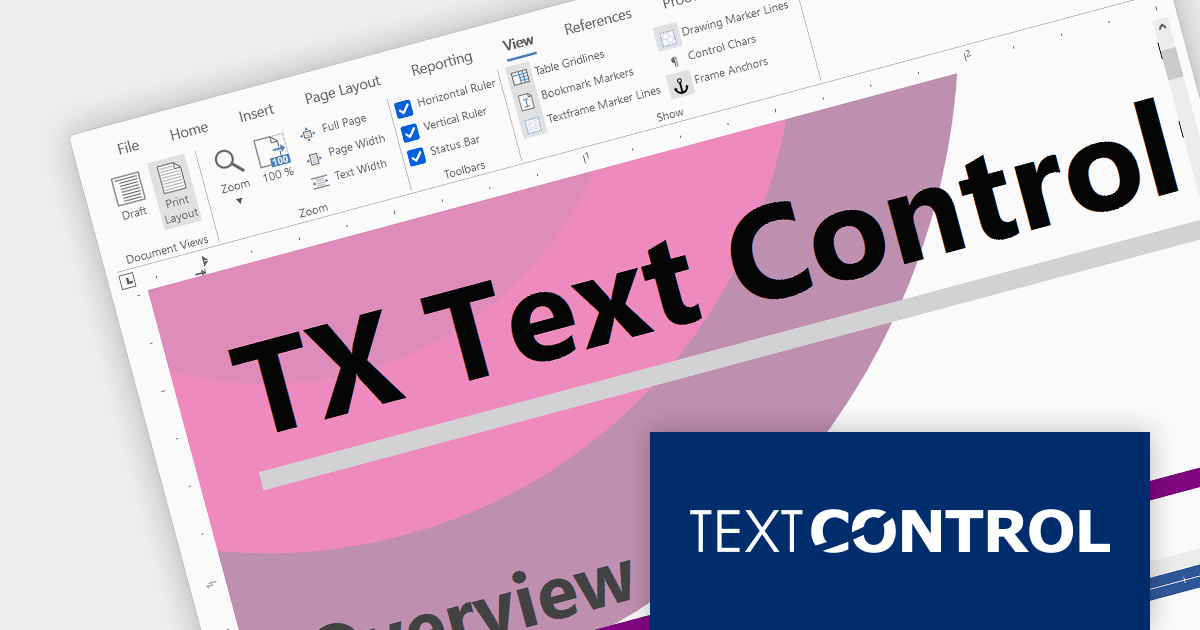
Text Control DS Server is an on-premise document services back-end for document processing. It includes a Microsoft Word compatible document editor, a lightweight document viewer, and a powerful document processing API.
Version 3.2.0 adds support for a new SVG rendering mode within the online document editor, improving performance in scenarios such as limited bandwidth or elevated ping times. By default the editor automatically determines the most suitable rendering method based on factors such as bandwidth availability.
To see a full list of what's new in version 3.2.0, see our release notes.
For more information, visit our Text Control DS Server product page.
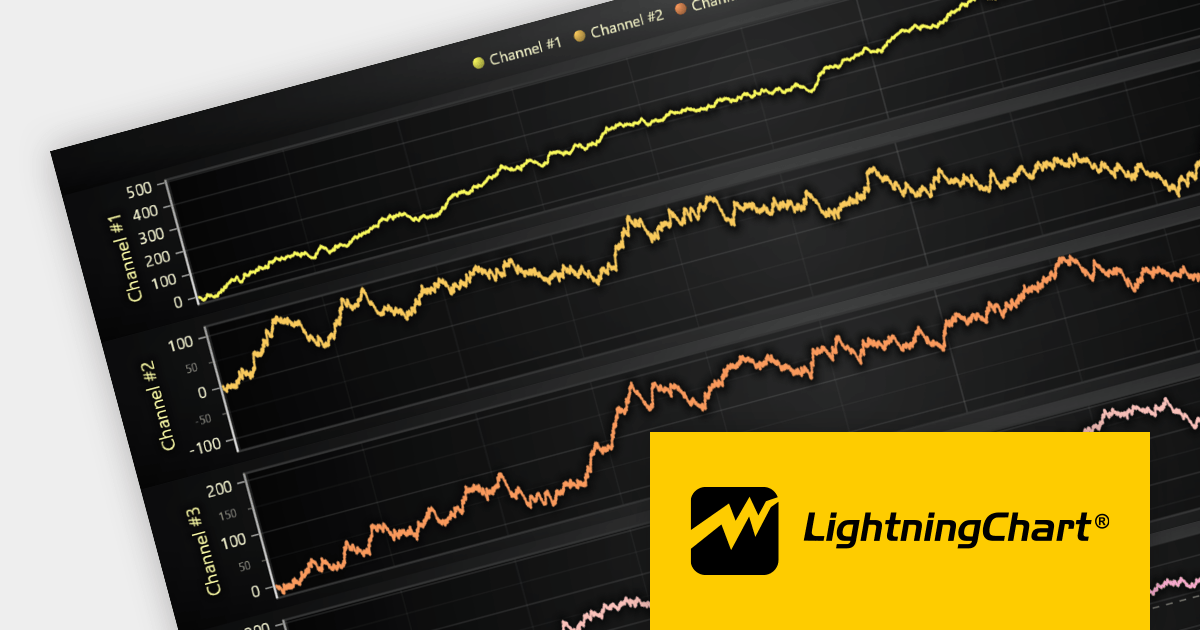
LightningChart JS is a high-performance JavaScript charting library that utilizes WebGL rendering and GPU acceleration to deliver exceptional performance for a wide range of data visualization needs. It is designed to handle large datasets and complex visualizations with ease, enabling developers to create interactive and visually appealing charts for various applications.
The LightningChart JS v5.0 release introduces WebGL context sharing, enabling the sharing of WebGL resources (e.g. textures, shaders, and buffers) across multiple WebGL contexts. This enhances the performance of multi-chart displays, minimizes memory consumption, and simplifies resource management. It optimizes the rendering of each chart, regardless of their arrangement or quantity. Developers can now employ HTML <div> elements to define chart layouts and use CSS for precise control over positioning.
To see a full list of what's new in v5.0.0, see our release notes.
For more information, see our LightningChart JS product page.
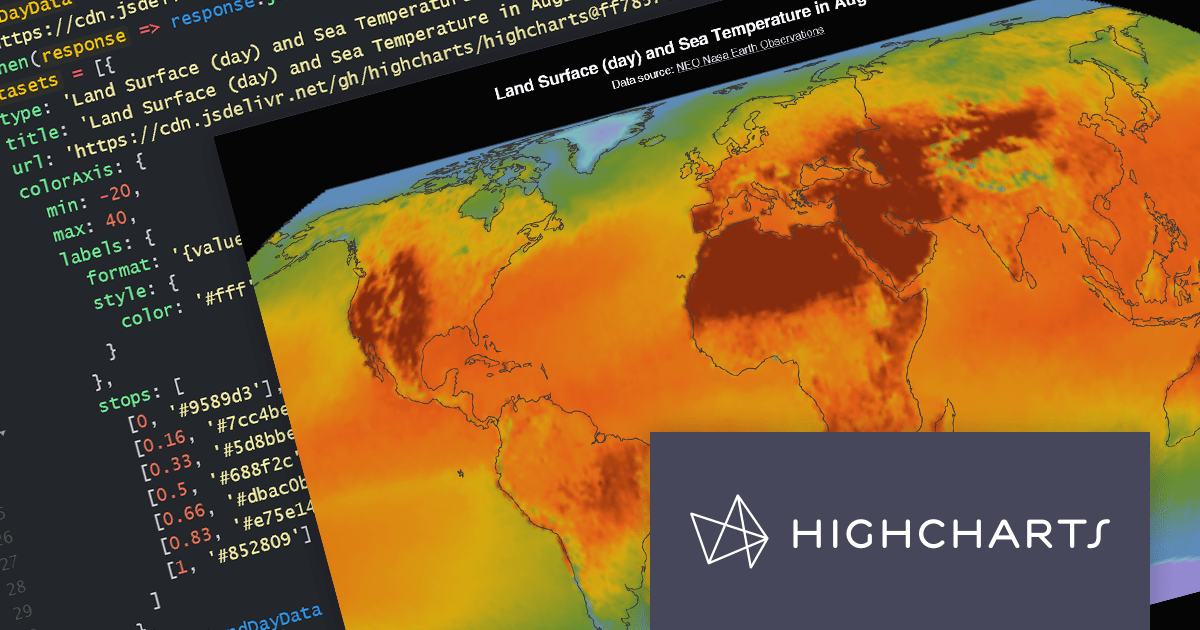
Highcharts Maps provides a standards-compliant method for creating schematic maps in web-based projects. It extends the user-friendly Highcharts JavaScript API to allow web developers to create interactive maps that display sales, election results, or any other geographically related information.
The Highchartts Maps v11.2.0 release adds support for interpolation in geographic heatmaps. The geoheatmap.interpolation feature allows the heatmap to render its data points as an interpolated image, estimating values between known data points. For example, you may have a have a table of temperature data that shows the temperature at specific points within a region. You can use interpolation to estimate the temperature in areas between the known data points. This new feature helps to create more easily understandable and visually appealing heatmaps, even with limited data sets.
To see a full list of what's new in version 11.2.0, see our release notes.
For more information, visit our Highcharts Maps product page.


Tel: (888) 850 9911
Fax: +1 770 250 6199


