


Fornitore ufficiale
In qualità di distributori ufficiali e autorizzati, forniamo licenze software legittime direttamente da più di 200 autori di software.
Vedi tutte le nostre marche

DevExpress Office File API is a robust library designed to simplify the creation, editing, and processing of popular office document formats, including Word, Excel, PowerPoint, and PDF. It allows developers to integrate advanced document management features into their applications without relying on external software like Microsoft Office. Key features include document generation, data import/export and template customization. The API supports advanced formatting, encryption, and digital signatures, ensuring secure and professional-grade output.
The DevExpress Office File API now includes full support for PowerPoint tables, allowing applications to upload and save presentations that contain tabular data and interact with that data through code. Developers can read existing tables, modify their structure and content, remove tables that are no longer needed, or create entirely new tables from scratch. This addition makes it easier to automate report generation, update presentation data, and integrate PowerPoint files into document processing workflows where tables play a central role.
DevExpress Office File API is licensed per developer and is available as a Perpetual License with a 12 month support and maintenance subscription. See our DevExpress Office File API licensing page for full details.
DevExpress Office File API is available individually or as part of DevExpress Universal.
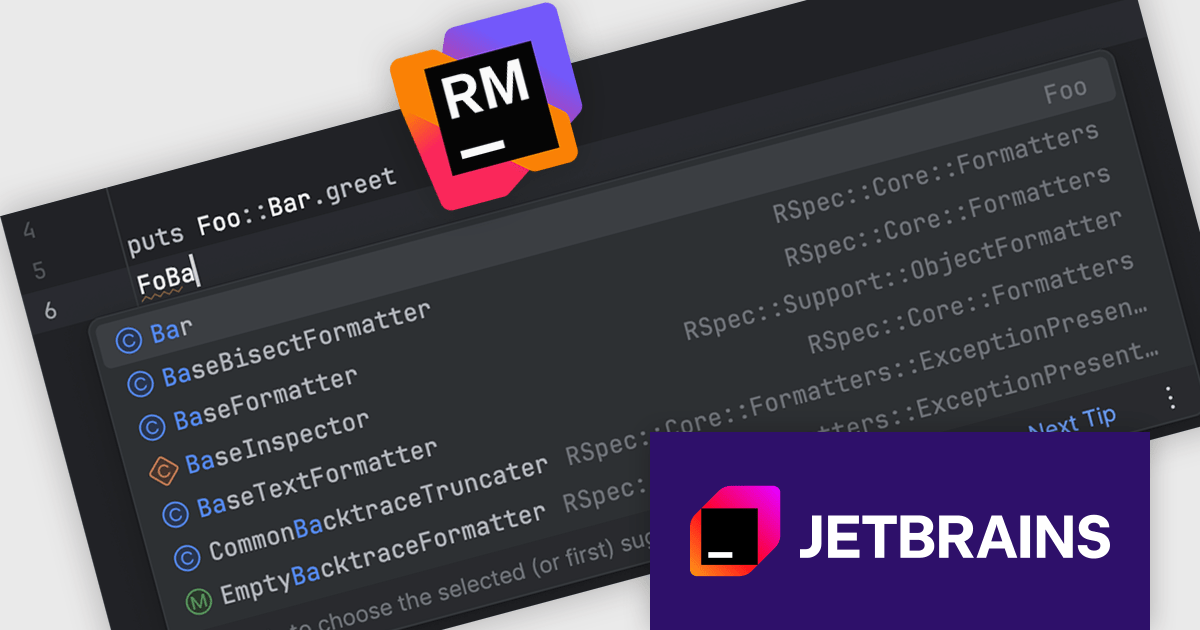
RubyMine by JetBrains is a Integrated Development Environment (IDE) specifically designed for Ruby and Ruby on Rails development. It offers a comprehensive suite of features to improve your coding efficiency, including smart code completion, syntax highlighting, code refactoring tools, built-in debugging and testing frameworks, and integration with popular libraries and databases. Whether you're a seasoned Rails developer or just starting out, RubyMine's intuitive interface and robust features can help you write cleaner, more maintainable code and accelerate your development.
The RubyMine 2025.3 release enhances code completion for qualified constants by introducing fuzzy search across namespaces. This lets developers type partial names, such as "FoBa", and receive accurate suggestions like "Foo::Bar", even when dealing with deeply nested structures. The update helps speed up navigation and code writing in projects with large or hierarchically organized modules, making it easier to locate and use the right constants with minimal input.
To see a full list of what's new in version 2025.3, see our release notes.
RubyMine is licensed per user, and is available as a commercial annual subscription license. We can supply new subscriptions, subscription renewals, lapsed renewals, and additional user licenses. See our RubyMine licensing page for full details.
RubyMine is available to buy in the following products:
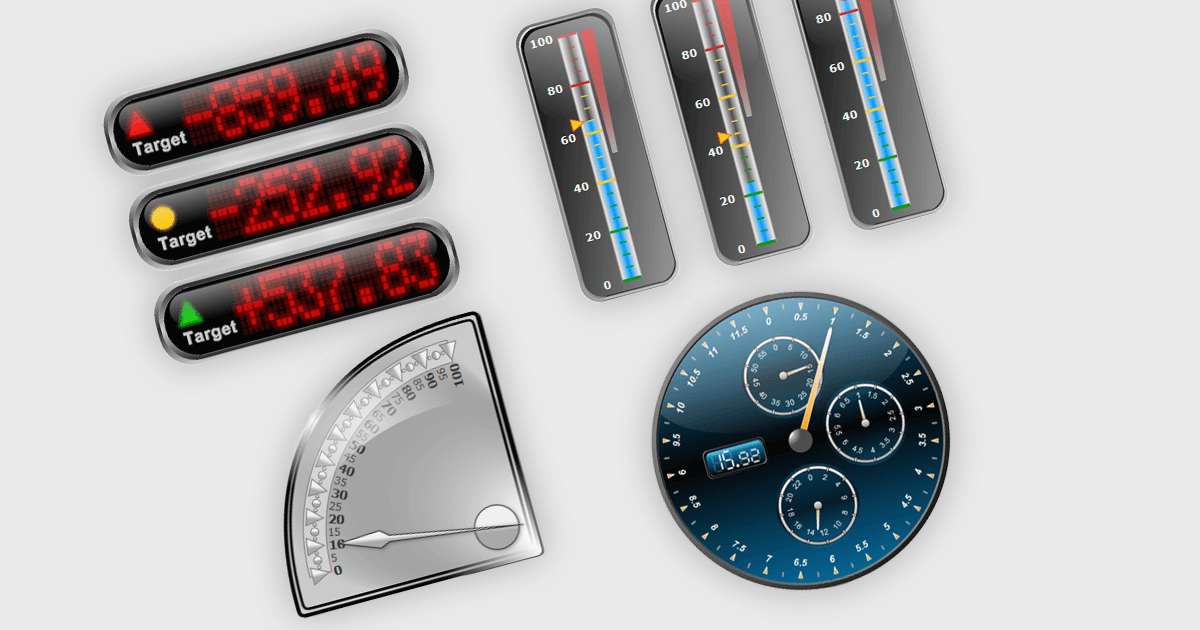
Gauge controls in .NET WPF UI suites are specialized visual components designed to present quantitative data in an intuitive, instrument-style format, similar to speedometers, thermometers, or dial indicators. They are commonly used in dashboards and monitoring applications to display key performance indicators, thresholds, and real-time metrics with clear visual cues such as ranges, tick marks, color-coded segments, and animated needles or pointers. Built to integrate with WPF’s data binding, templating, and styling capabilities, gauge controls allow developers to connect live data sources, customize appearance through themes and templates, and define ranges or alerts that highlight critical values. This makes them particularly useful in industrial systems, financial dashboards, health monitoring tools, and other applications where quick visual interpretation of numeric data is essential.
Many .NET WPF UI Suites contain gauges including:
For an in-depth analysis of features and price, visit our comparison of .NET WPF UI Suites.
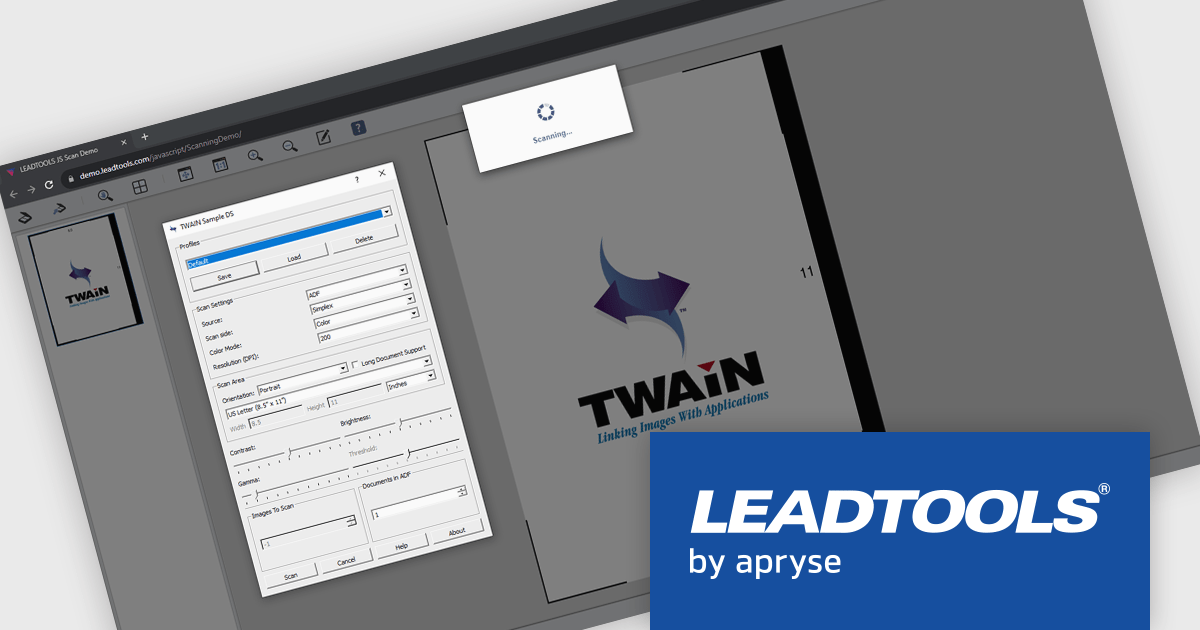
LEADTOOLS Document Suite is a comprehensive set of document imaging SDKs designed to facilitate document processing and management tasks within software applications. It offers developers advanced capabilities for tasks such as OCR (Optical Character Recognition), barcode recognition, PDF manipulation, document conversion, annotation, and more. Leveraging this suite, developers can integrate sophisticated document functionality into their software solutions, enabling efficient handling of various document formats and improving productivity in document-centric processes.
LEADTOOLS Document Suite SDK provides Fast TWAIN support that enables software developers to implement high performance, reliable document scanning directly within their applications. By accelerating image acquisition and optimizing scanner communication, it reduces development complexity while supporting high volume and batch scanning scenarios. Captured images can be routed into OCR, image cleanup, compression, and document processing pipelines, allowing developers to build efficient, end to end document capture and automation solutions without relying on external scanning components.
LEADTOOLS Document Suite SDK is licensed as Development Licenses, for developers to use the SDKs, and Deployment Licenses, for the right to distribute end user solutions. See our LEADTOOLS Document Suite SDK licensing page for full details.
Learn more on our LEADTOOLS Document Suite SDK product page.
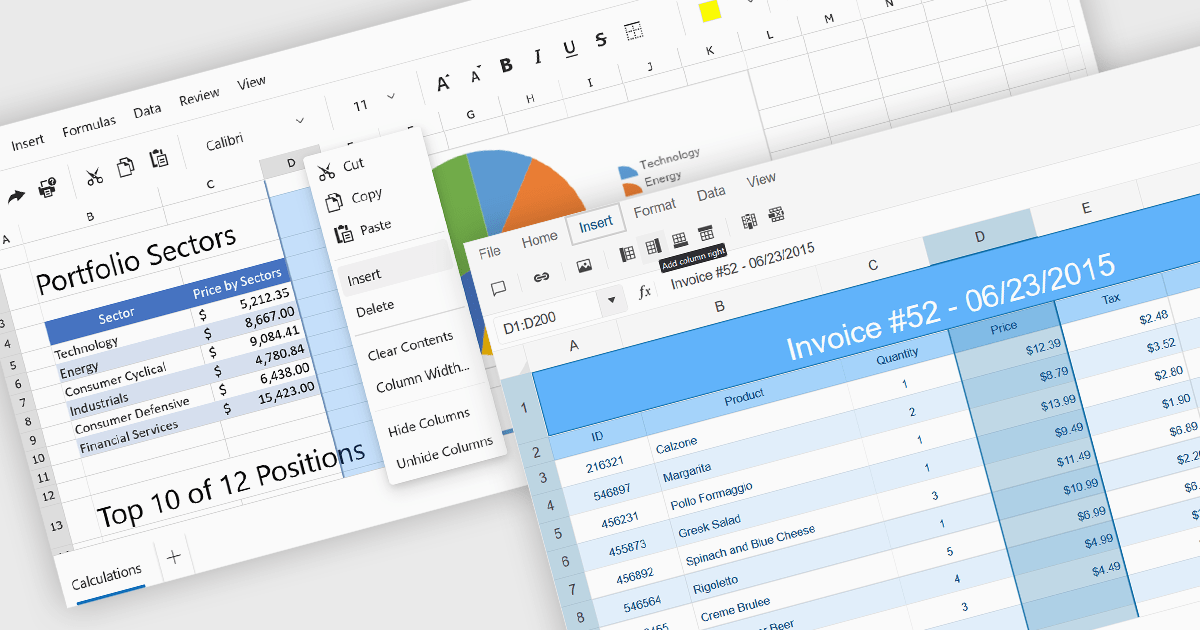
Inserting columns in a spreadsheet allows users to expand worksheets dynamically while preserving existing data and formulas. This capability is essential for scenarios where datasets evolve over time, such as adding new fields, categories, or calculated values. A well-implemented insert columns feature ensures that cell references, formatting, and formulas adjust automatically, helping maintain data integrity and reducing the risk of errors during updates.
Several ASP.NET Core spreadsheet controls offer the ability to insert columns including:
For an in-depth analysis of features and price, visit our ASP.NET Core spreadsheet controls comparison.


Tel: (888) 850 9911
Fax: +1 770 250 6199


