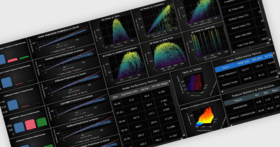
LightningChart Python
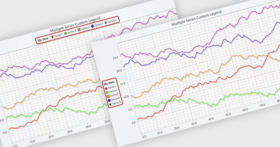
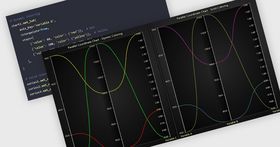
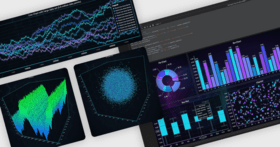
Una libreria di visualizzazione dei dati 2D e 3D ad alte prestazioni con accelerazione GPU per applicazioni Python di data science e sviluppo software.
Pubblicato da LightningChart
Distribuito da ComponentSource dal 2021
Prezzi da: US$ 882.00 Versione: v2.2 Aggiornato il: Apr 7, 2026