


Fornitore ufficiale
In qualità di distributori ufficiali e autorizzati, forniamo licenze software legittime direttamente da più di 200 autori di software.
Vedi tutte le nostre marche

Wijmo is a cutting-edge collection of over 100 high-performance JavaScript UI controls designed for modern enterprise applications. Built for speed and flexibility, Wijmo empowers developers to deliver superior user experiences with fully responsive, touch-friendly, and accessible components.
In this blog post, MESCIUS Product Manager Joel Parks demonstrates effective strategies for handling complex and unstructured data using FlexGrid, Wijmo's high-performance JavaScript datagrid for modern web and mobile applications. Topics include:
Detailed sample code is included to help you along the way.
Read the complete blog and learn how to use Wijmo's FlexGrid to handle the quirks and imperfections of real-world datasets.
Wijmo is licensed per developer. Developer Licenses are perpetual and include 1 year Subscription which provides upgrades, including bug fixes and new features. See our Wijmo licensing page for full details.
Learn more on our Wijmo product page.
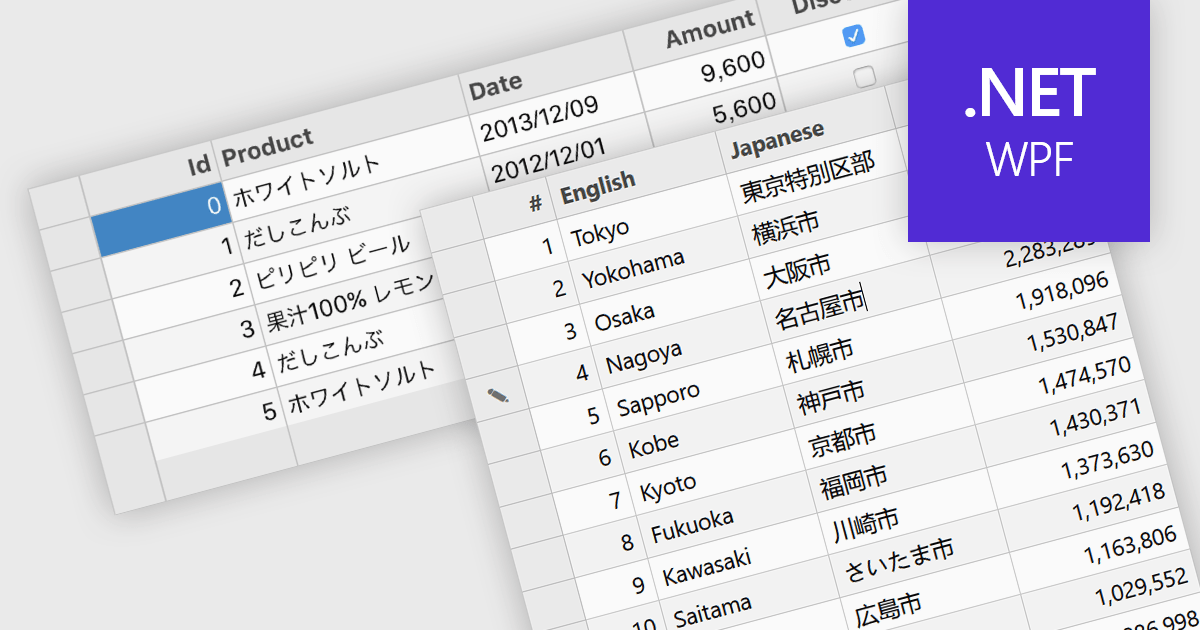
Input Method Editor (IME) support refers to the capability of an application or control to correctly handle complex text input, particularly for languages that require composition, such as Chinese, Japanese, and Korean. IME enables users to enter characters that are not directly available on a physical keyboard by converting sequences of keystrokes into the correct script, improving accessibility and usability for multilingual input. When applied to a data grid within an application, this capability ensures that users can reliably enter and edit multilingual text directly within grid cells without input loss or formatting issues. IME support in a data grid is especially valuable for applications that manage structured data across regions, as it allows accurate entry of names, descriptions, and other localized content while preserving normal grid behaviors such as editing, validation, and navigation.
Several WPF grid components include Input Method Editor support, including:
For an in-depth analysis of features and price, visit our comparison of WPF grid components.
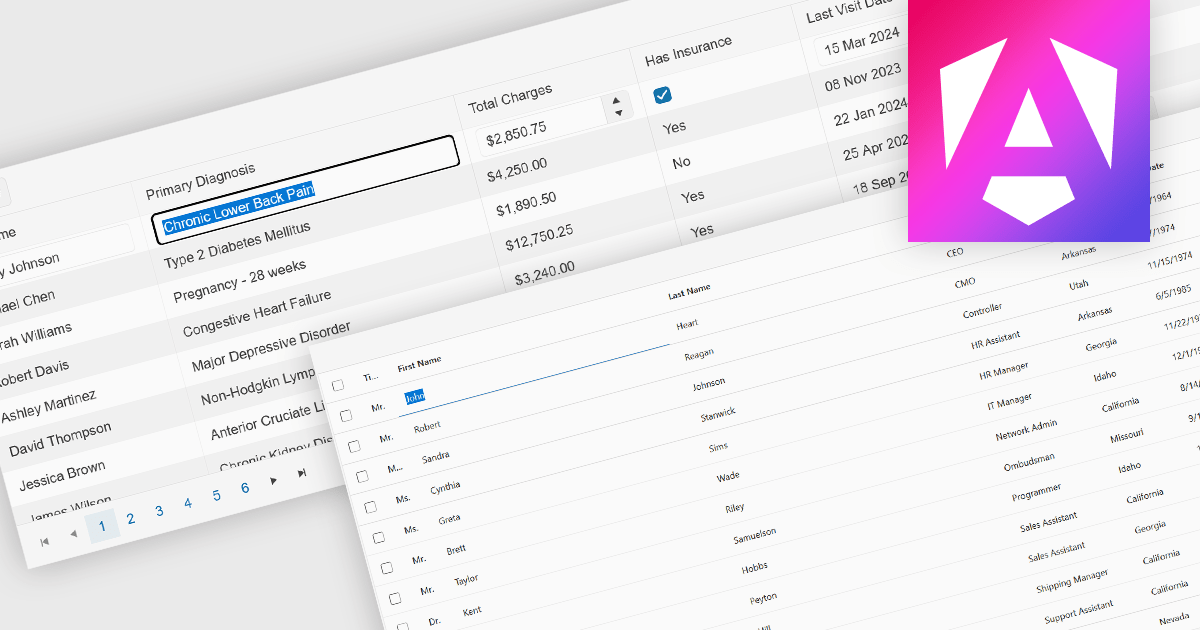
Inline editing is an essential feature of modern grid components, allowing users to create, update, and validate data directly within tabular views. By enabling edits in place, without navigating away from the grid, these features support faster data entry and improve usability in data-intensive applications such as administration panels, financial systems and line-of-business tools.
Several Angular grid controls offer inline editing features, including:
For an in-depth analysis of features and price, visit our Angular grid controls comparison.
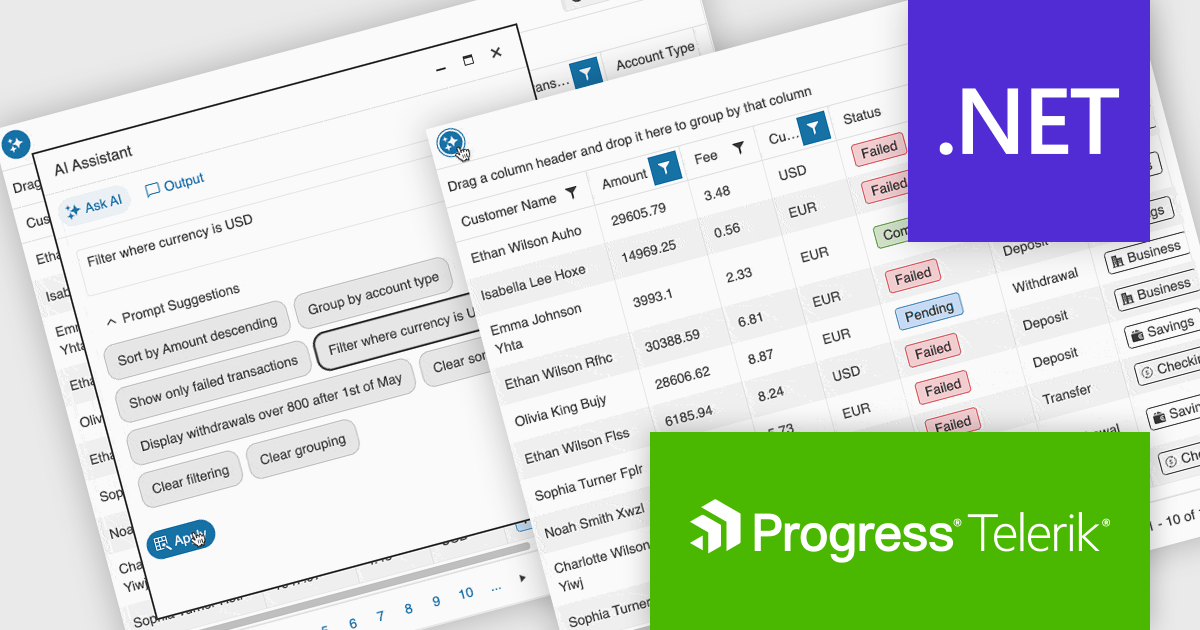
Telerik UI for ASP.NET Core, MVC, and Blazor are component libraries for building modern web apps with .NET. Each provides a rich set of customizable UI elements, like grids, charts, and forms, tailored to its respective framework, helping developers create responsive, interactive, and accessible user interfaces.
The latest update to the Telerik UI DataGrid introduces AI-driven controls that respond to natural-language prompts, making it easier for users to work with complex datasets. Users can now reorder, resize, and toggle column visibility just by describing what they want. Pagination, row selection, and data export to Excel, PDF, or CSV formats can also be handled through conversational input, reducing clicks and improving accessibility for both technical and non-technical users.
Telerik UI for ASP.NET Core, UI for MVC, and UI for Blazor are all licensed per developer and have two licensing models: an annual Subscription License and a Perpetual License. The Subscription License must be renewed to continue using the software. The Perpetual license is a one-time purchase granting access to the current released version and includes a one-year subscription for product updates and technical support. See our Telerik UI for ASP.NET Core, Telerik UI for ASP.NET MVC or Telerik UI for Blazor licensing pages for full details.
Telerik UI for ASP.NET Core, Telerik UI for ASP.NET MVC and Telerik UI for Blazor are available to buy individually or as part of the following products:

DevExtreme Complete is a robust suite of tools by DevExpress designed to streamline the development of high-performance web applications. It includes a wide range of UI components for modern frameworks such as Angular, React, Vue, and jQuery, making it ideal for developers aiming to create responsive, cross-platform applications with ease. With features like rich data visualization, interactive grids, form controls, and adaptive layouts, it empowers developers to deliver polished and user-friendly interfaces. Whether you're building enterprise dashboards or consumer-facing apps, DevExtreme Complete provides the flexibility and power to meet complex requirements while maintaining performance and usability.
The DevExtreme Complete 25.2 release brings AI Columns to its DataGrid and TreeList components, allowing developers to infuse artificial intelligence directly into their data presentation layers. AI Columns use component data and custom prompts to generate contextually relevant values - automating tasks like categorization, summarization, translation, and recommendation. Whether grouping records by priority, detecting sentiment, or transforming addresses, this feature opens up new ways to interact with and analyze structured data, making these components powerful tools for AI-assisted data exploration.
To see a full list of what's new in version 25.2, see our release notes.
DevExtreme Complete is licensed per developer and is available as a Perpetual License with a 12 month support and maintenance subscription. See our DevExtreme Complete licensing page for full details.
DevExtreme Complete is available to buy individually or as part of the following products:


Tel: (888) 850 9911
Fax: +1 770 250 6199


