








Fornitore ufficiale
In qualità di distributori ufficiali e autorizzati, forniamo licenze software legittime direttamente da più di 200 autori di software.
Vedi tutte le nostre marche
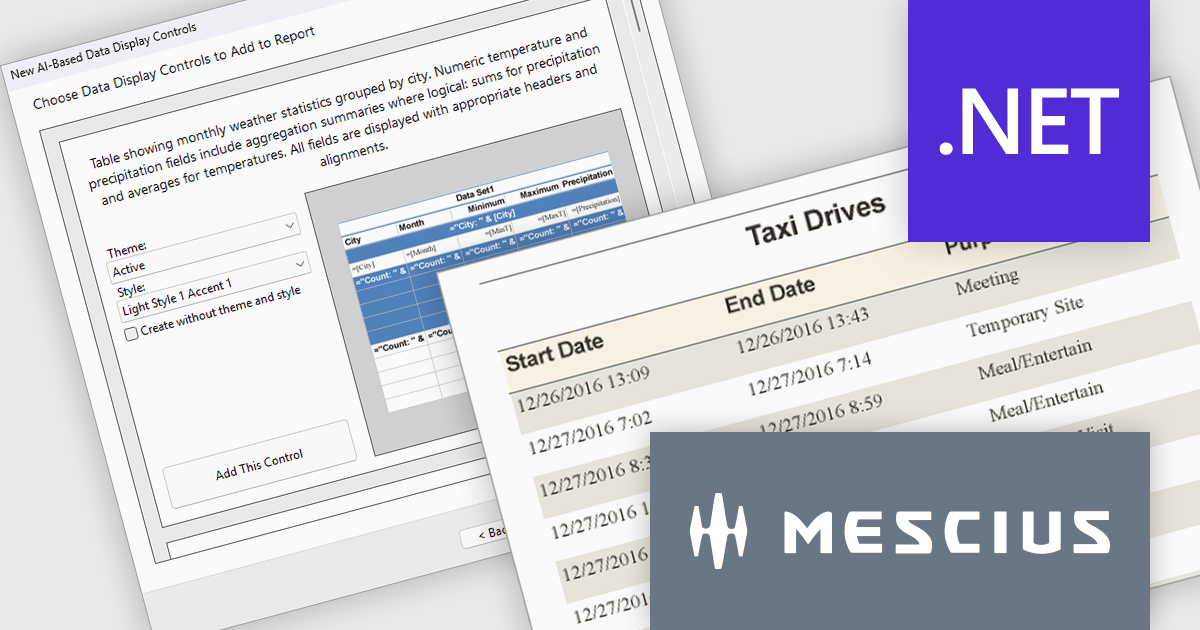
ActiveReports.NET by MESCIUS is a reporting solution for the Microsoft .NET platform that enables developers to create and deliver data-driven reports in web, desktop, and cloud applications. It supports multiple report types, including section, page, and RDL (Report Definition Language) reports, and provides visual designers, a robust rendering engine, and export options such as PDF and Excel. Designed to integrate with modern .NET and ASP.NET Core applications, it helps teams build interactive, enterprise-grade reporting features into their software.
The ActiveReports.NET v20.1 update includes AI Driven Smart Data Regions, enabling developers to generate cleaner and more consistent report layouts automatically. By applying standardized date formatting, removing duplicate columns, and using structured grouped table layouts with appropriate headers, footers, and page breaks, it reduces the need for manual report refinement while improving readability and navigation. This enhancement helps development teams deliver professional quality reports more efficiently and ensures more consistent results from AI generated report designs.
To see a full list of what's new in v20.1, see our release notes.
ActiveReports.NET is licensed per developer. Dependent on geographic location it is available as either an Annual (Timed) Subscription License or as a Perpetual Developer License which comes with 1 year of software updates and support. Each developer requires a license to design, develop, or maintain applications. The Annual Subscription License must be renewed each year to continue to work with the software. Published applications are royalty free and do not expire. Optional pipeline licenses available for CI/CD build servers. See our ActiveReports.NET licensing page for full details.
Learn more on our ActiveReports.NET product page.
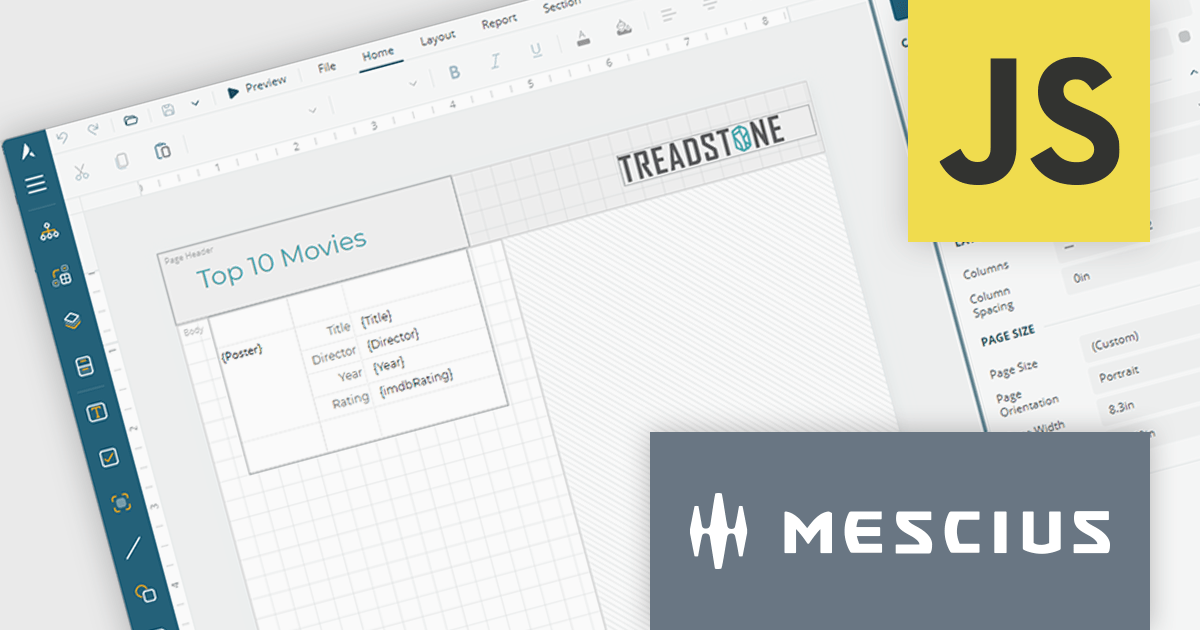
ActiveReportsJS by MESCIUS is a JavaScript reporting toolkit that allows developers to design and embed interactive reports within web applications. It includes a standalone report designer for building reports visually and a JavaScript report viewer component that integrates with web frameworks such as React or vanilla JavaScript. The toolkit supports a range of data visualization options and export formats, helping developers deliver rich, interactive reporting capabilities in the browser.
The ActiveReportsJS Report Designer now offers a more intuitive design-time experience for multi-column reports. Column splits are displayed directly on the design surface, providing clear visual guidance when creating report layouts. To help maintain layout accuracy, controls can be placed in the primary column while additional columns are automatically generated at runtime as content grows. This approach makes it easier to design, preview and manage multi-column reports while reducing the risk of unexpected layout issues.
To see a full list of what's new in 6.1, see our release notes.
ActiveReportsJS is licensed on an annual subscription or perpetual basis and is available as a Single Deployment License for non-commercial use, and as a Single Domain License or Unlimited Domain License for commercial and/or SaaS use. See our ActiveReportsJS licensing page for full details.
Learn more on our ActiveReportsJS product page.
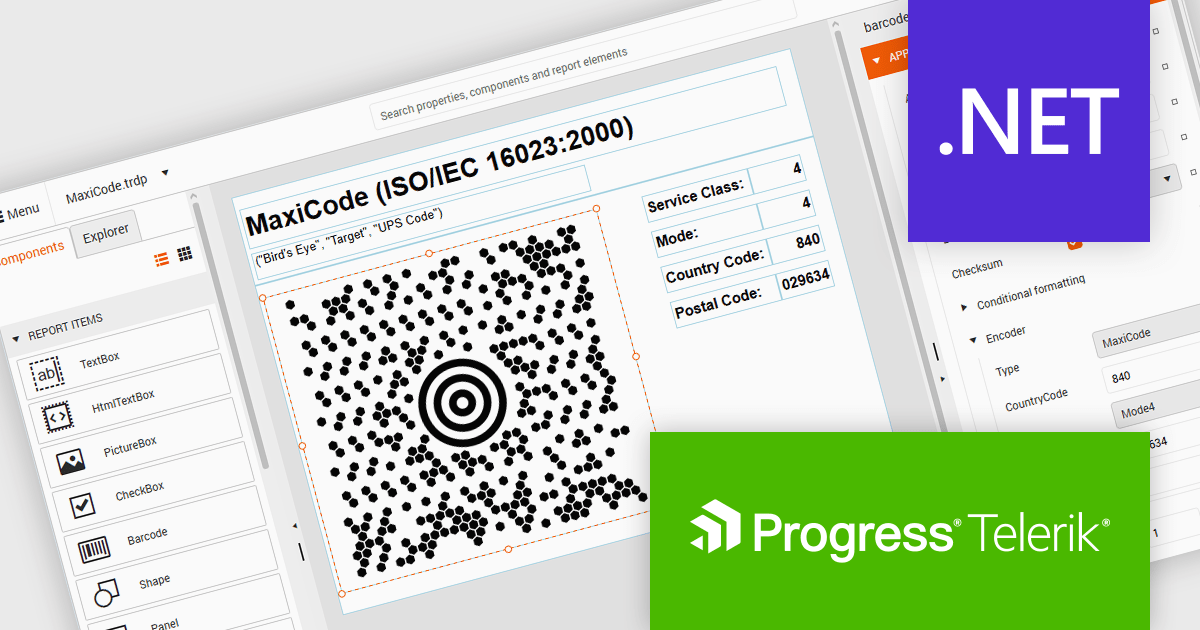
Telerik Reporting and Telerik Report Server deliver a complete solution for creating, managing, and distributing reports across .NET applications. Telerik Reporting is a lightweight, embedded reporting tool for .NET web and desktop apps. It lets developers and users easily design, customize, and export interactive, reusable reports. It supports multiple platforms, including ASP.NET Core, Blazor, MVC, AJAX, HTML5/JS, Angular, WPF, WinForms, and WinUI. Telerik Report Server is a web-based, server-side solution for centralized report management. Built on Telerik Reporting, it offers scheduling, delivery, user management, and web-based access. It can be used standalone or integrated into apps built with Blazor, Angular, or Windows Forms.
The Telerik Reporting and Report Server 2026 Q2 update adds MaxiCode barcode support, enabling developers to generate UPS-compatible shipping labels directly within Telerik reporting workflows without relying on separate labeling tools. The enhancement ensures accurate MaxiCode rendering across export formats including PDF, HTML, DOCX, XAML, Image, and RTF, while allowing barcode generation, scheduling, distribution, and reporting to be managed from a single platform. This helps organizations streamline shipping and fulfillment processes, automate high-volume delivery workflows through scheduled reports and data alerts, and reduce operational complexity.
To see a full list of what's new, see our release notes for Telerik Reporting and Telerik Report Server 2026 Q2.
Telerik Reporting is licensed per developer and is available as an Annual Subscription License, which includes product updates, technical support, AI Productivity Tools, and other benefits for 12 months. Telerik Report Server is licensed per domain, with each license including 15 Client Access Licenses (CALs) and 12 months of support and maintenance. See our licensing pages for full details. See our licensing pages for Telerik Reporting and Telerik Report Server for full details.
Telerik Reporting and Telerik Report Server are available individually or as part of Telerik DevCraft Ultimate.
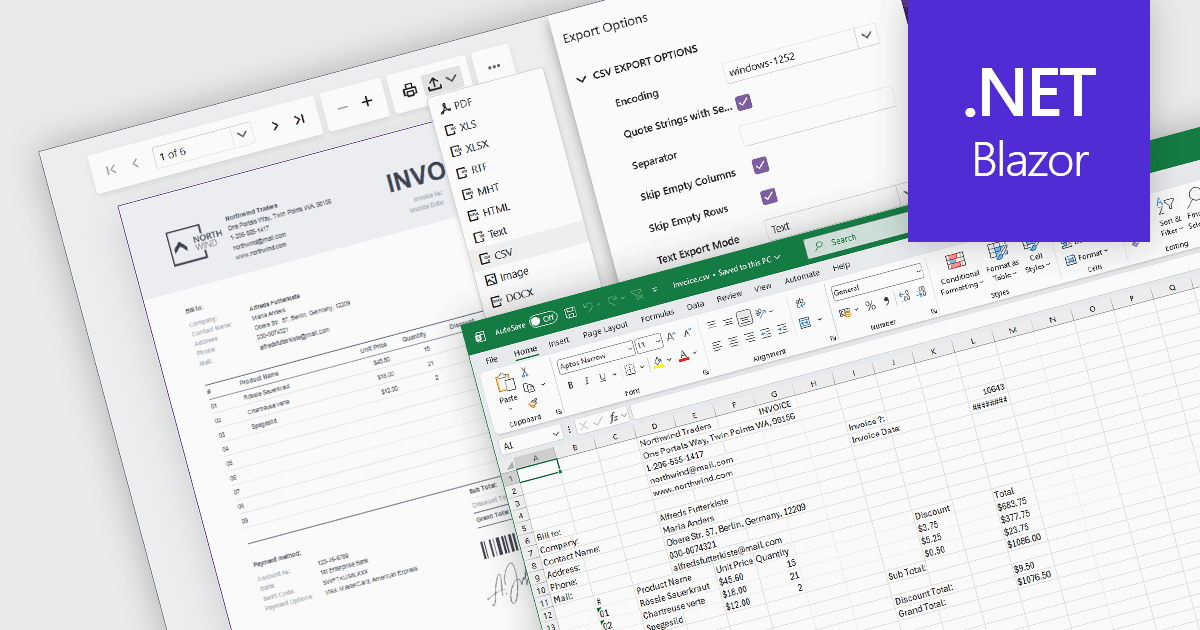
Exporting reports to CSV (Comma-Separated Values) format provides a simple and widely compatible way to transfer report data into spreadsheet applications, databases, analytics platforms, and other business systems. CSV files store structured data as plain text, making them easy to process, automate, archive, and exchange across different environments. For software developers and business users, CSV export functionality supports data analysis, operational reporting, integration workflows, and data retention requirements while maintaining low file complexity and broad platform support.
Several Blazor reporting components allow you to export to CSV, including:
For an in-depth analysis of features and price, visit our comparison of Blazor reporting components.
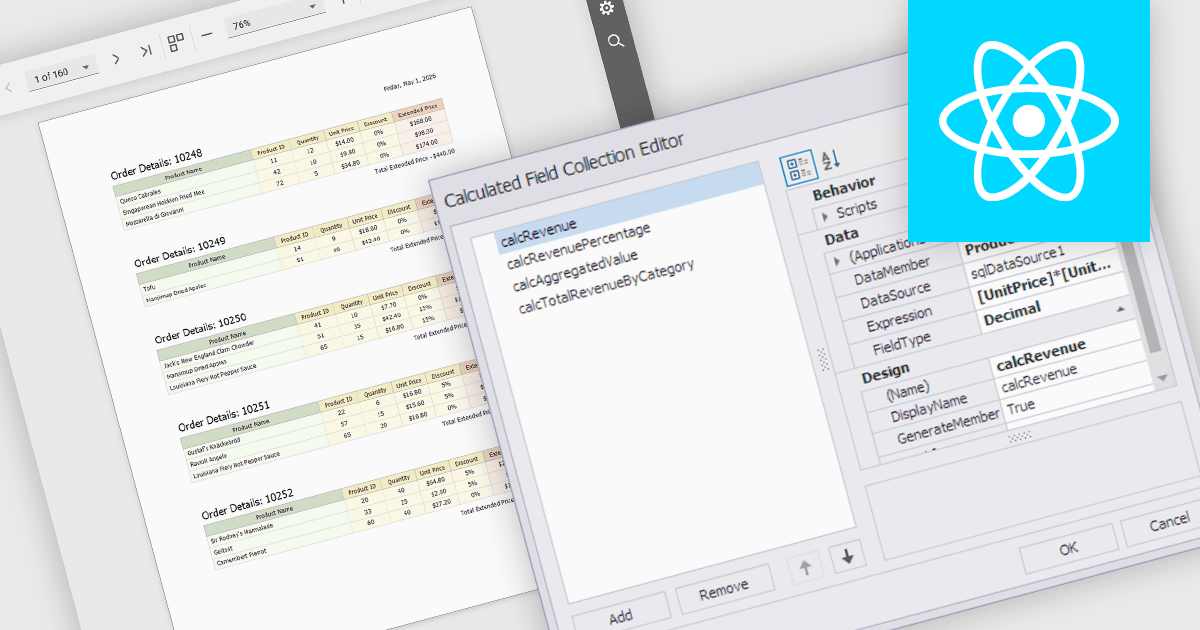
Calculated fields are dynamic values derived from existing data within reporting components. They enable complex data manipulations, calculations, and transformations, providing enhanced data analysis capabilities. By creating new fields based on existing data, calculated fields offer flexibility and efficiency, allowing users to perform calculations, aggregations, and logical comparisons directly within the report. This empowers users to generate insights, visualize trends, and make data-driven decisions without requiring modifications to the underlying data source, ultimately improving report accuracy and usability.
Several React reporting controls offer support for calculated fields:
For an in-depth analysis of features and price, visit our React reporting controls comparison.





Tel: (888) 850 9911
Fax: +1 770 250 6199


