


Fornitore ufficiale
In qualità di distributori ufficiali e autorizzati, forniamo licenze software legittime direttamente da più di 200 autori di software.
Vedi tutte le nostre marche
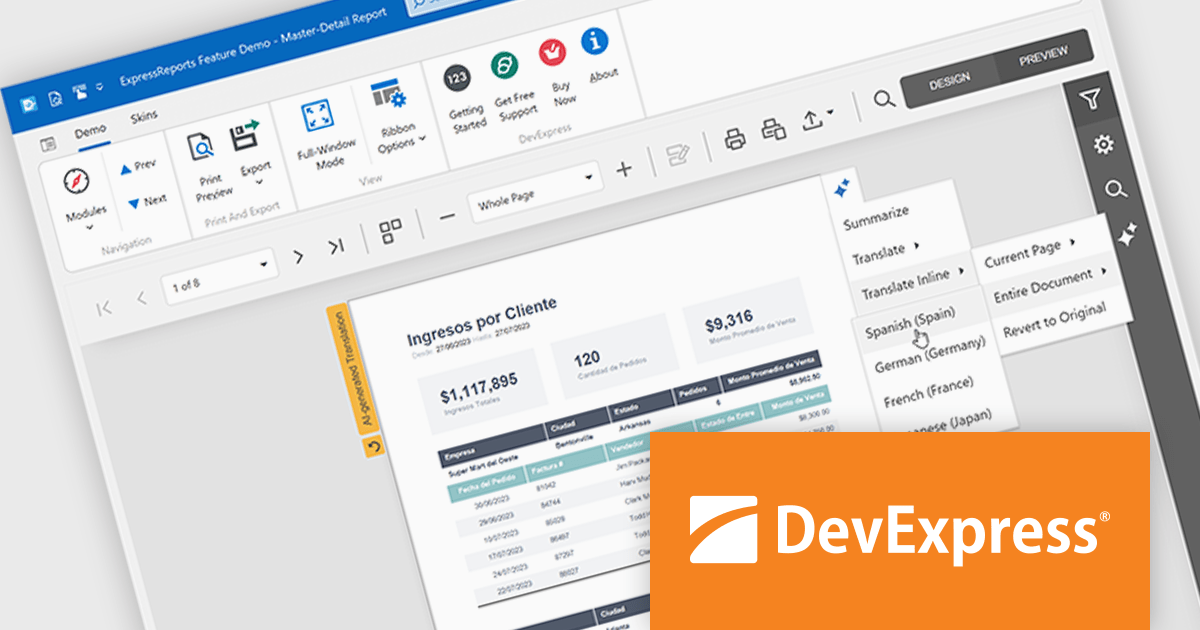
DevExpress (Developer Express) is an award-winning software development company based in the United States. It produces coding assistance tools and components for Delphi, C++ Builder and Microsoft Visual Studio developers. The major part of its product line is VCL, .NET WinForms and ASP.NET components that replicate the UI of Microsoft Windows and Microsoft Office applications.
With the recent release of version 25.1, the entire DevExpress product line has undergone significant changes:
This powerful new functionality comes at a higher price. DevExpress has implemented price raises across all product lines for both new licenses and renewals. To view all of the current, updated prices, see the comprehensive product list on the DevExpress Brand Page.
**Note: If you have a current, valid quote from ComponentSource at the previous pricing, the price will be honored up to that quote's expiration date.
The DevExpress VCL Subscription + (DevExpress VCL Subscription Plus) includes:
DevExpress Reporting is available to buy in the following products:
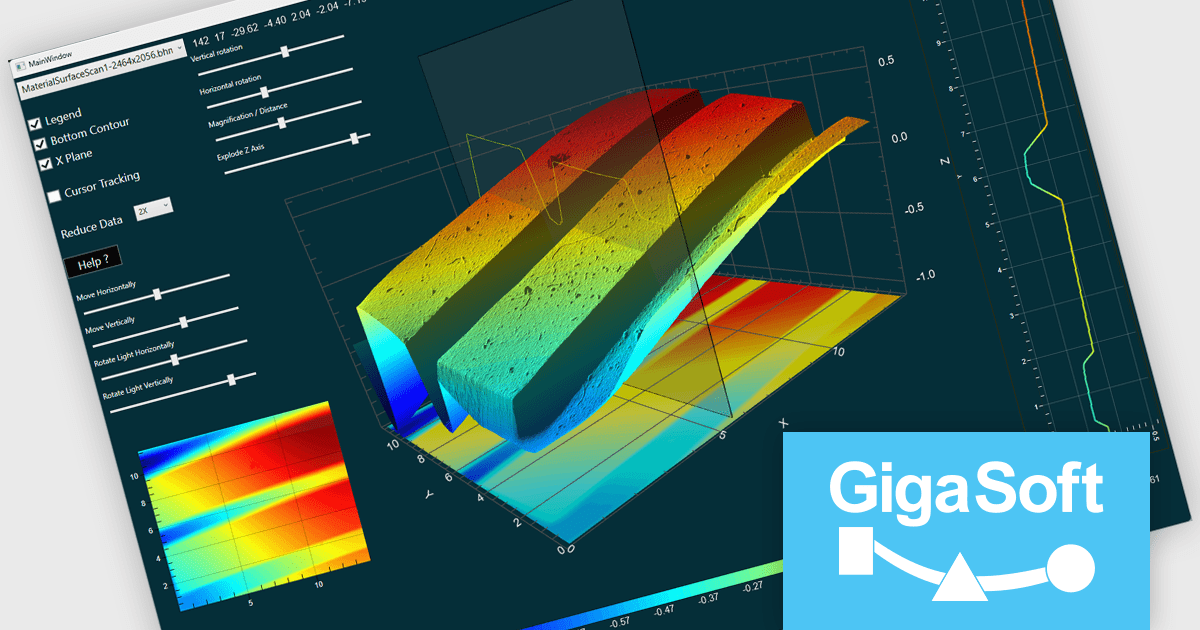
Gigasoft ProEssentials is a robust charting library for Windows development, providing a wide array of 2D and 3D chart types. The product offers a versatile suite of components, such as Graph, Scientific Graph, and 3D Scientific Graph, enabling the creation of sophisticated visualizations. It's extensive support for various platforms and development environments, including WPF, WinForm, and integration with popular IDEs like Visual Studio, enhances flexibility and empowers developers to efficiently visualize data within their applications.
The Gigasoft ProEssentials provides Direct3D rendering, significantly enhancing scene construction performance. By leveraging the parallel processing power of the GPU, this feature accelerates the rendering process compared to traditional CPU-based methods. This results in faster visualization of complex scenes, improved responsiveness, and a more efficient use of system resources, ultimately enabling developers to create more performant and visually impressive applications.
Gigasoft ProEssentials is licensed per developer and is available as a perpetual license with free technical support and maintenance for the life of the version. See our Gigasoft ProEssentials licensing page for full details.
For more information, visit our Gigasoft ProEssentials product page.
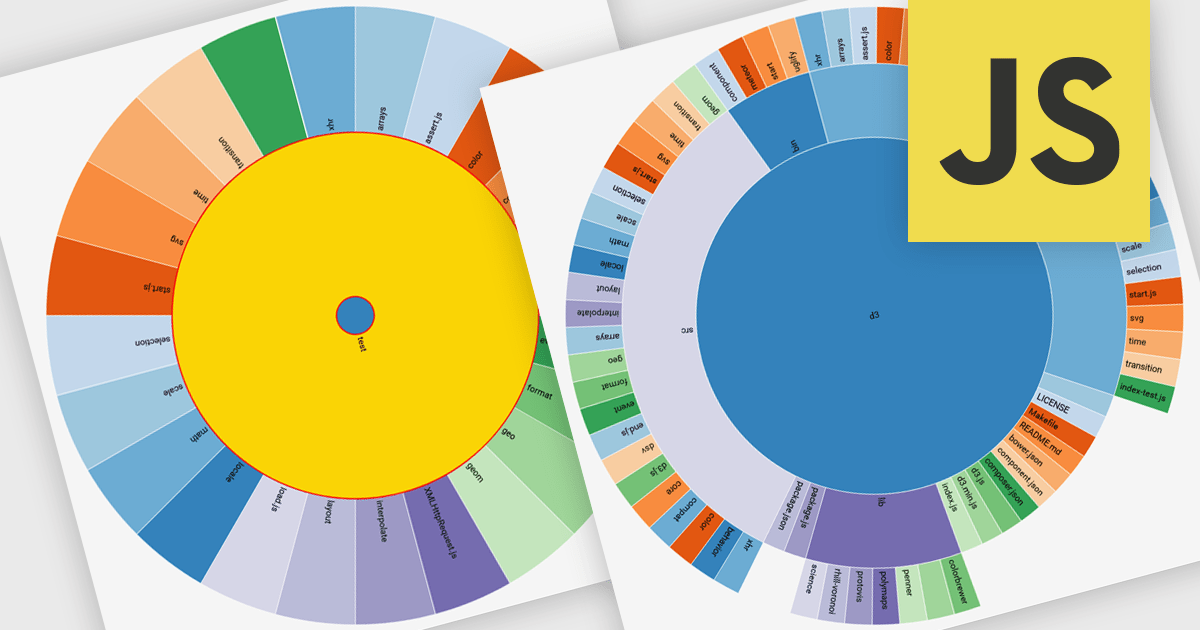
Radial charts are circular data visualizations used to represent hierarchical, proportional, or cyclical data. A key type is the sunburst chart, which displays multi-level hierarchies using concentric rings, where each ring represents a level and each segment shows a category or subcategory. This format helps users quickly grasp both structure and proportion. Sunburst charts are ideal for exploring complex data in a compact space and are commonly used for visualizing organizational charts, file systems, website structures, and product categories. Their interactive format allows users to drill into data for deeper insight without losing context.
Several JavaScript charting components provide you with radial charts, including:
For an in-depth analysis of features and price, visit our JavaScript chart components comparison.
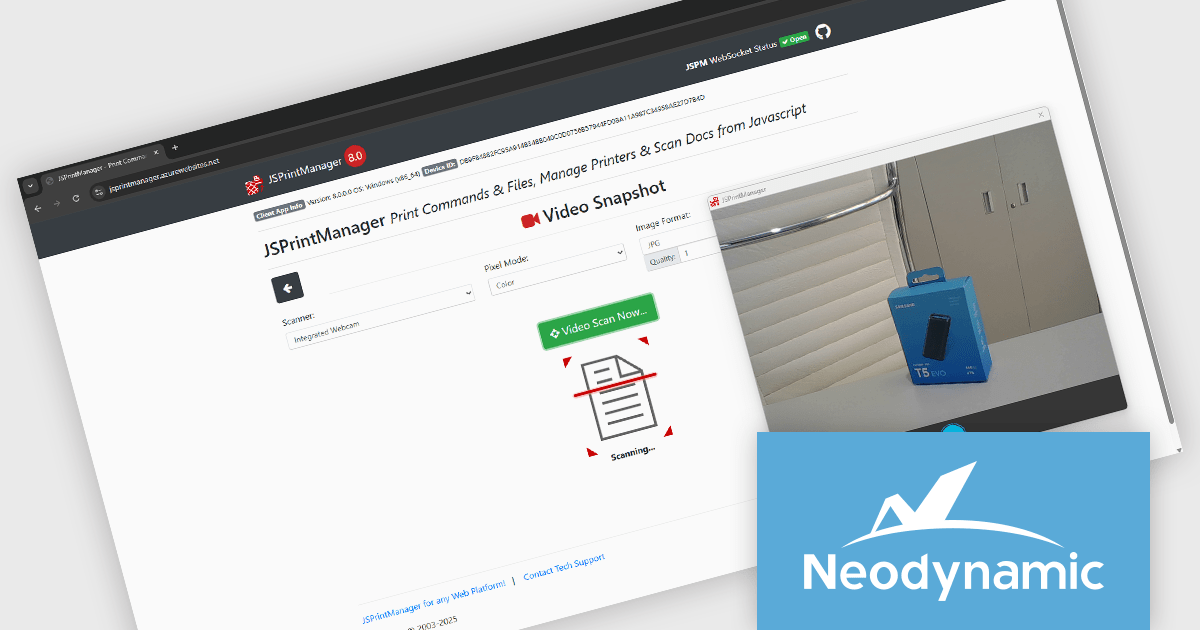
Neodynamic offers two JSPrintManager solutions for client-side printing and scanning in web applications. JSPrintManager for Any Web Platform allows you to integrate printing functionality into any website built with technologies like ASP.NET, PHP, or Blazor using pure JavaScript. Neodynamic also offers JSPrintManager for Blazor which enables you to seamlessly add printing capabilities to your Blazor server or WebAssembly projects with C# code. Both solutions empower you to print various data formats directly from the browser without requiring user interaction with print dialogs.
The Neodynamic JSPrintManager 8.0 releases add the ability for the Windows Client to take a video snapshot through any video device available on the client PC. This means, for example, that a camera can be used as a scanner to take a snapshot/picture. This is particularly useful in contexts where quick documentation is needed, such as capturing IDs, receipts, or physical documents, without needing a separate scanning application. It reduces reliance on traditional scanners and broadens the type of input devices that can integrate with browser-based printing operations.
To see a full list of what's new in 8.0, see our release notes for JSPrintManager for Any Web Platform and JSPrintManager for Blazor.
Neodynamic JSPrintManager is licensed per Web App and Web server and is available as a Perpetual license which includes 1 year of free updates and priority support. See our Neodynamic JSPrintManager for Any Web Platform and Neodynamic JSPrintManager for Blazor licensing pages for full details.
Learn more on our Neodynamic JSPrintManager for Any Web Platform and Neodynamic JSPrintManager for Blazor product pages.
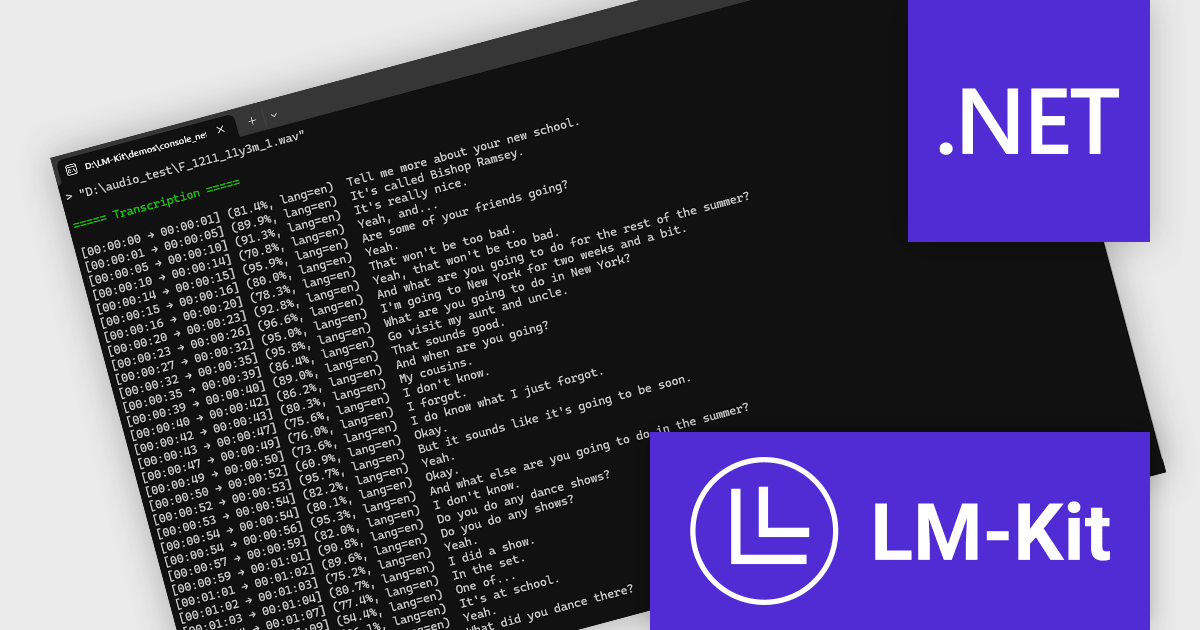
LM-Kit.NET is a cross-platform software development kit (SDK) designed to integrate advanced generative AI capabilities directly into .NET applications. It supports a wide range of functionalities, including text generation, translation, data extraction, and multimodal AI agent orchestration. The SDK operates entirely on-device, ensuring enhanced privacy and reduced latency by eliminating the need for cloud-based processing. Developers can leverage LM-Kit.NET to build intelligent applications that process and analyze text, audio, and image data efficiently within the .NET ecosystem.
The addition of speech-to-text features in LM-Kit.NET significantly expands its utility, enabling real-time transcription and analysis of audio content. This functionality allows applications to convert spoken language into structured, actionable text data on-device, preserving user privacy and ensuring quick processing times. It supports over 100 languages, automatically detecting the spoken language without manual configuration, making it ideal for global and multilingual applications. By facilitating accurate and efficient transcription, LM-Kit.NET's speech-to-text capabilities enhance various use cases, from customer service analytics to accessibility features in educational platforms.
LM-Kit.NET is licensed per deployed commercial application per year. The license is subscription-based and must be renewed every year to continue using the Software. See our LM-Kit.NET licensing page for full details.
Learn more on our LM-Kit.NET product page.


Tel: (888) 850 9911
Fax: +1 770 250 6199


