.NET Reflector VSPro
Esegui il debug di codice di terze parti, anche se non disponi della sorgente.
Pubblicato da Redgate Software
Distribuito da ComponentSource dal 2005
Prezzi da: $ 256.41 Versione: 11.1.x Aggiornato il: Sep 15, 2021
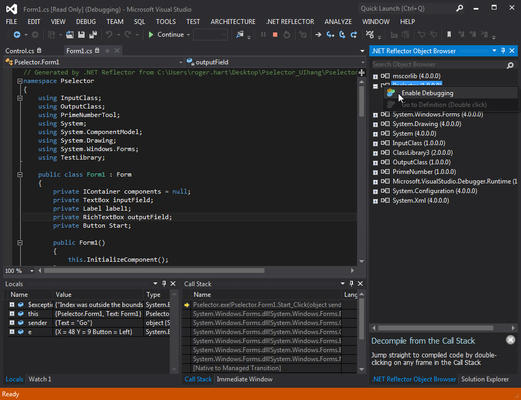
.NET Reflector lets you follow bugs through your own code, 3rd party components, and any compiled .NET code you work with. You can see 3rd party code in Visual Studio, and debug into it just like your own. Go to the definition of compiled code (F12), set breakpoints (F9), and step into it (F11). You can see how data flows through a library or component, and watch locals change as you debug, find dependencies, and track down the exact location of bugs and performance issues.


Having the source code available means you’re no longer blocked by poor or missing documentation. So you can see how code runs, avoid bugs and develop more easily with 3rd party technologies. .NET Reflector supports the latest .NET languages, and decompiles high level C# features such as async, Iterator blocks, Lambda expressions, and LINQ queries.


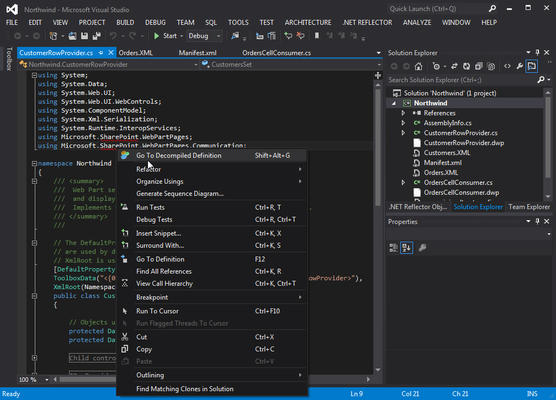
.NET Reflector works with Visual Studio 2012 (and VS 2010), letting you decompile and debug 3rd party code without leaving the IDE. Decompilation in Visual Studio is dynamic, so source code is always available for your libraries, and you can go straight to the definition of any code, either from the context menu, or by hitting F12.


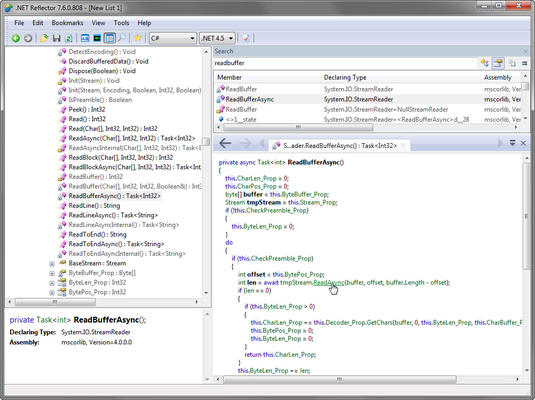
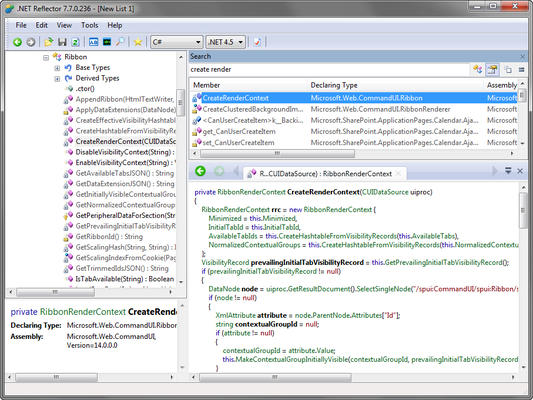
.NET Reflector makes it easy to browse through and search decompiled code. The analysis features let you quickly jump to entry points, find dependencies, and see where methods are used. You can see where interfaces are implemented and trace the data flow of your code. You can search for types, members, strings, and quickly drill into how APIs and frameworks are implemented.

