


공식 공급 업체
200 이상의 소프트웨어 개발처와 판매 계약을 맺은 공인 디스트리뷰터로서 합법적인 라이선스를 제공합니다.
모든 브랜드 보기.
영어로 계속 읽기:
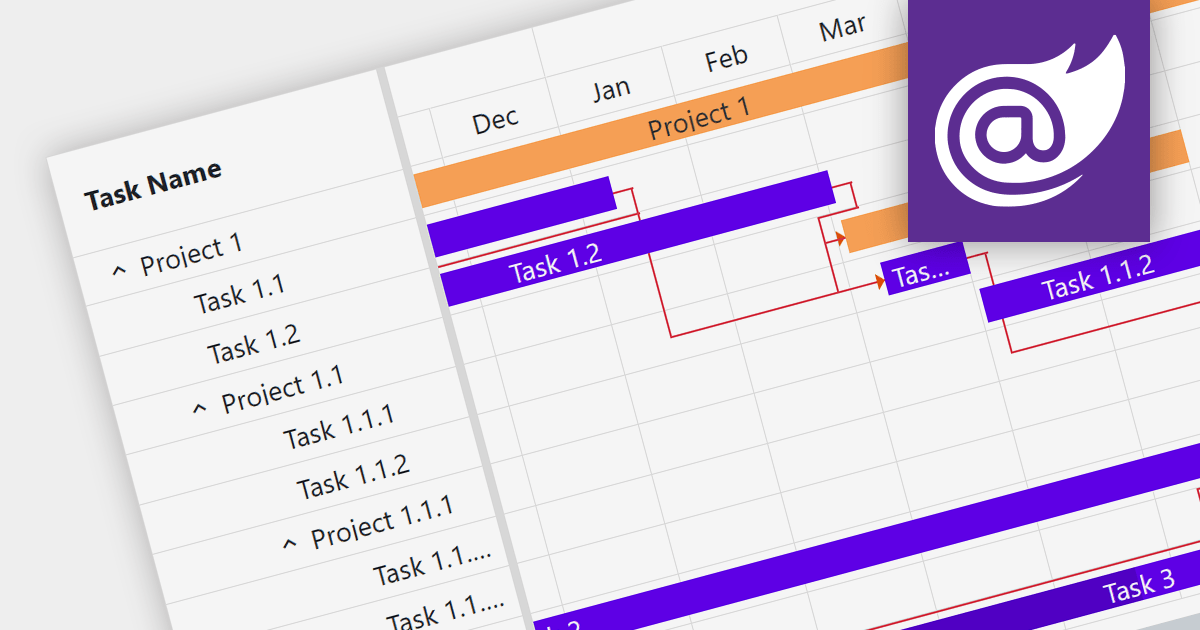
Gantt charts are a type of bar chart designed to illustrate project schedules. They display the start and end dates of different elements of a project and are essential for project management. These charts are useful for tracking project progress and for planning by showing how project tasks overlap and relate to each other.
Several Blazor chart components provide Gantt charts including:
For an in-depth analysis of features and price, visit our Blazor Charts comparison.
전화 : 00798 14 800 6332
팩스 : +1 770 250 6199


