


공식 공급 업체
200 이상의 소프트웨어 개발처와 판매 계약을 맺은 공인 디스트리뷰터로서 합법적인 라이선스를 제공합니다.
모든 브랜드 보기.
영어로 계속 읽기:
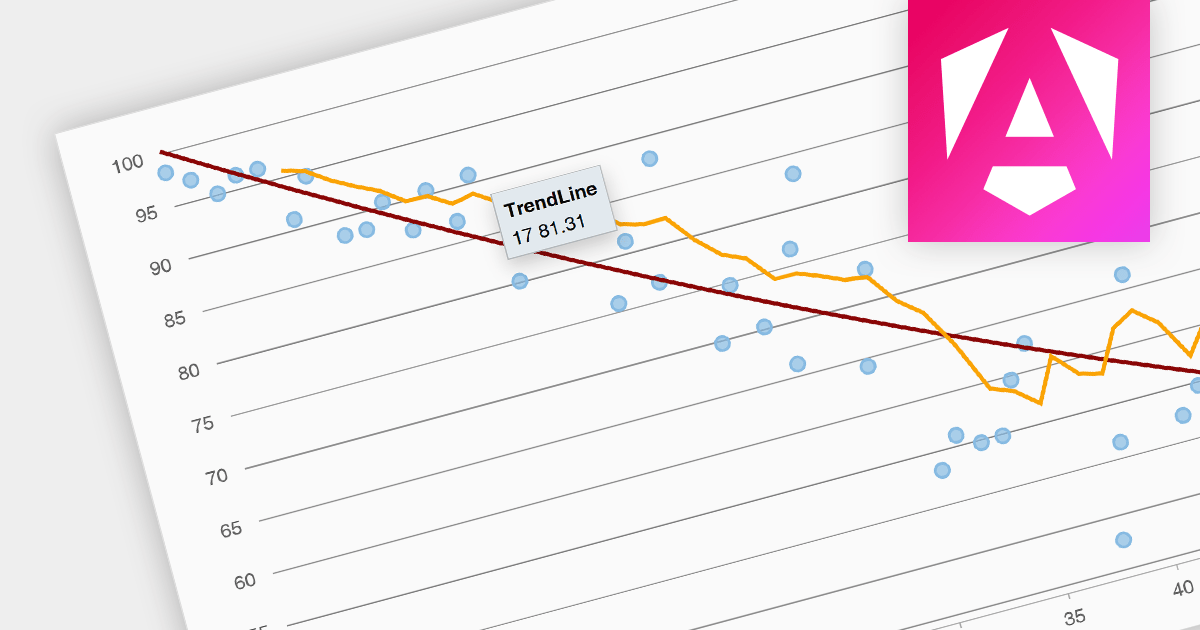
Trend lines are a chart feature used to indicate patterns or trends in data over time. Common examples include linear, exponential, polynomial, logarithmic, and moving average. Trend lines are crucial for making predictions or understanding the direction of data points in scatter plots and line charts, helping make data-driven decisions.
Several Angular chart components provide trend line support including:
For an in-depth analysis of features and price, visit our Angular Chart Component comparison.
전화 : 00798 14 800 6332
팩스 : +1 770 250 6199


