


공식 공급 업체
200 이상의 소프트웨어 개발처와 판매 계약을 맺은 공인 디스트리뷰터로서 합법적인 라이선스를 제공합니다.
모든 브랜드 보기.
영어로 계속 읽기:
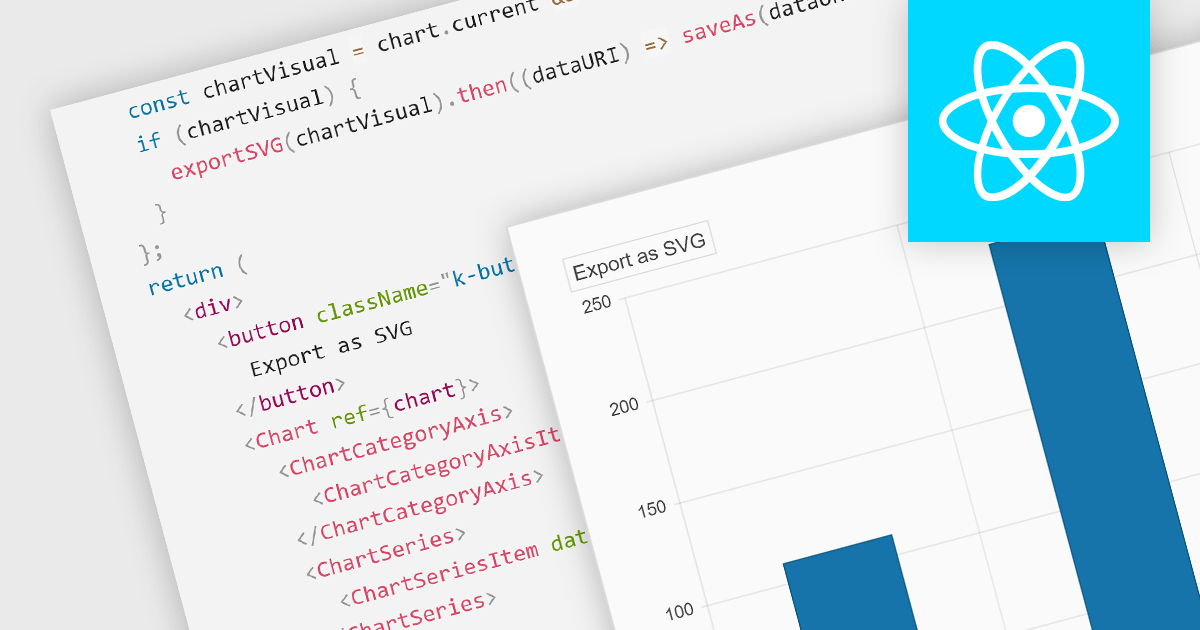
Exporting charts to SVG (Scalable Vector Graphics) format is vital for maintaining high-quality visuals in digital formats. SVGs are resolution-independent, meaning they retain their quality at any size, which is crucial for presentations or reports that might be viewed on different devices. This feature allows users to share their charts outside the chart creation tool while ensuring visual fidelity and sharpness.
Several React chart controls offer support for exporting to SVG including:
For an in-depth analysis of features and price, visit our React chart controls comparison.
전화 : 00798 14 800 6332
팩스 : +1 770 250 6199


