


공식 공급 업체
200 이상의 소프트웨어 개발처와 판매 계약을 맺은 공인 디스트리뷰터로서 합법적인 라이선스를 제공합니다.
모든 브랜드 보기.
영어로 계속 읽기:
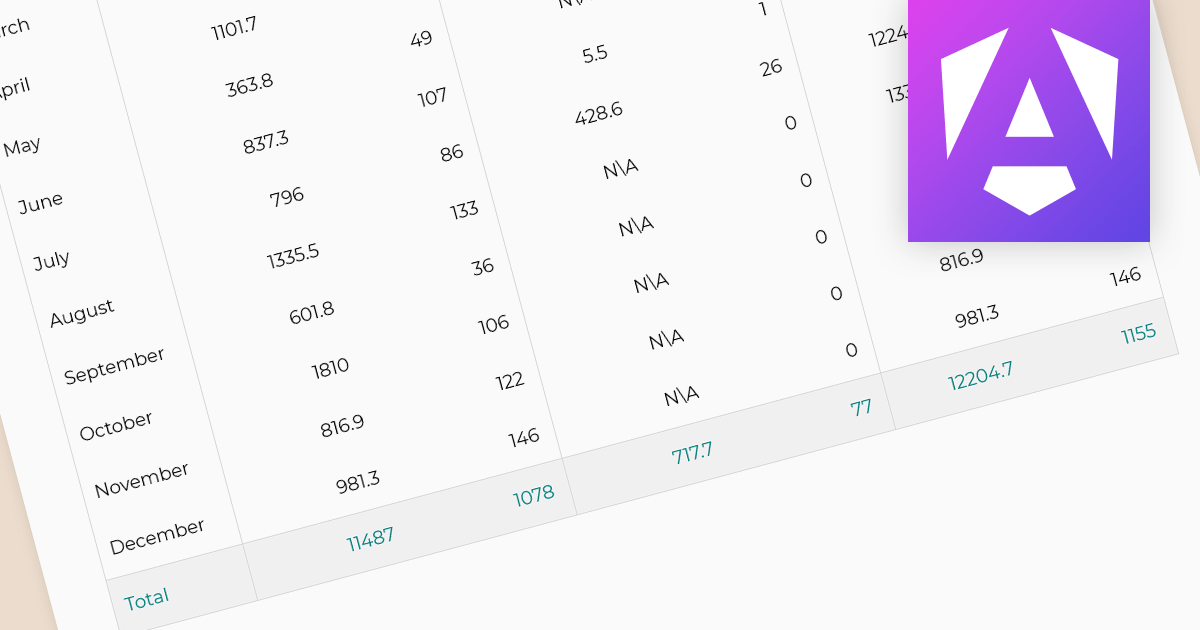
In reporting tools, summaries and aggregates are powerful tools for condensing and presenting large datasets into meaningful insights. Summaries condense data by highlighting key points, such as averages, counts, or maxima/minima, often using text or visuals. Aggregates mathematically combine data points, like calculating sums, means, or medians, typically displayed in tables or charts. Both approaches help users quickly grasp the essence of the data, identify trends, and make informed decisions. Summaries act as concise narratives and aggregates as numerical snapshots, working together to paint a clear picture from complex information.
The following Angular reporting components support summaries and aggregates:
For an in-depth analysis of features and price, visit our Angular Reporting Components comparison.
전화 : 00798 14 800 6332
팩스 : +1 770 250 6199


