


공식 공급 업체
200 이상의 소프트웨어 개발처와 판매 계약을 맺은 공인 디스트리뷰터로서 합법적인 라이선스를 제공합니다.
모든 브랜드 보기.
영어로 계속 읽기:
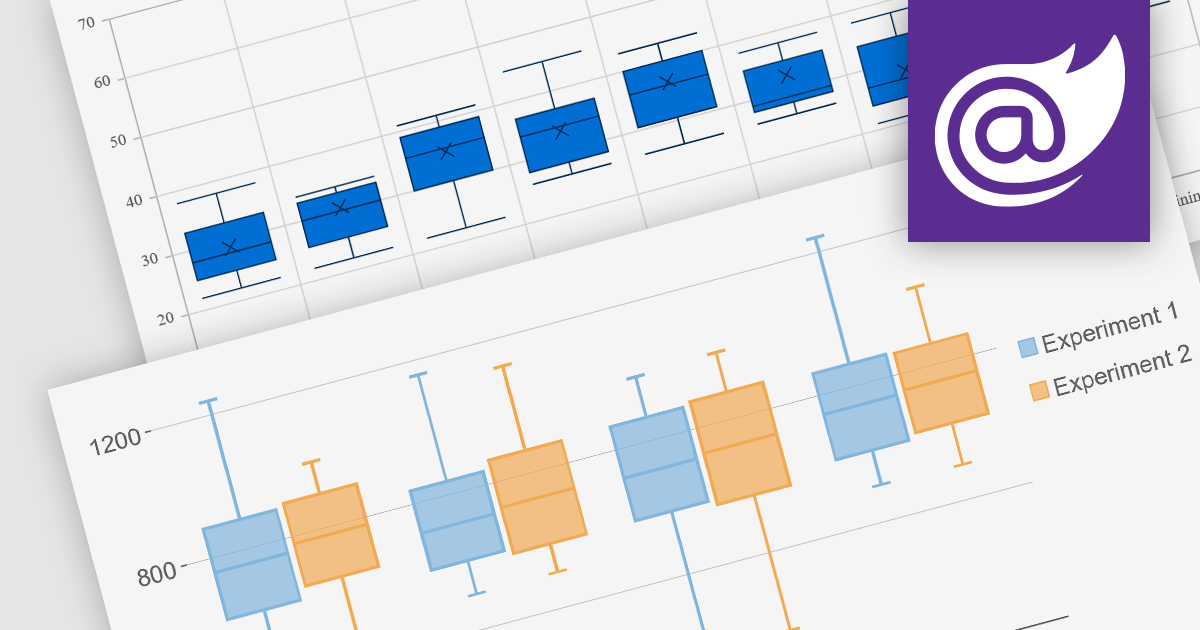
Box plots, also known as box-and-whisker plots, are used to display the distribution of a dataset. They show the median, quartiles, and extremes of the data, providing a quick visual summary of the data's central tendency and variability. This makes them particularly useful for statistical analysis and comparing data across categories.
Several Blazor chart controls offer Box plots including:
For an in-depth analysis of features and price, visit our Blazor chart controls comparison.
전화 : 00798 14 800 6332
팩스 : +1 770 250 6199


