


공식 공급 업체
200 이상의 소프트웨어 개발처와 판매 계약을 맺은 공인 디스트리뷰터로서 합법적인 라이선스를 제공합니다.
모든 브랜드 보기.
영어로 계속 읽기:
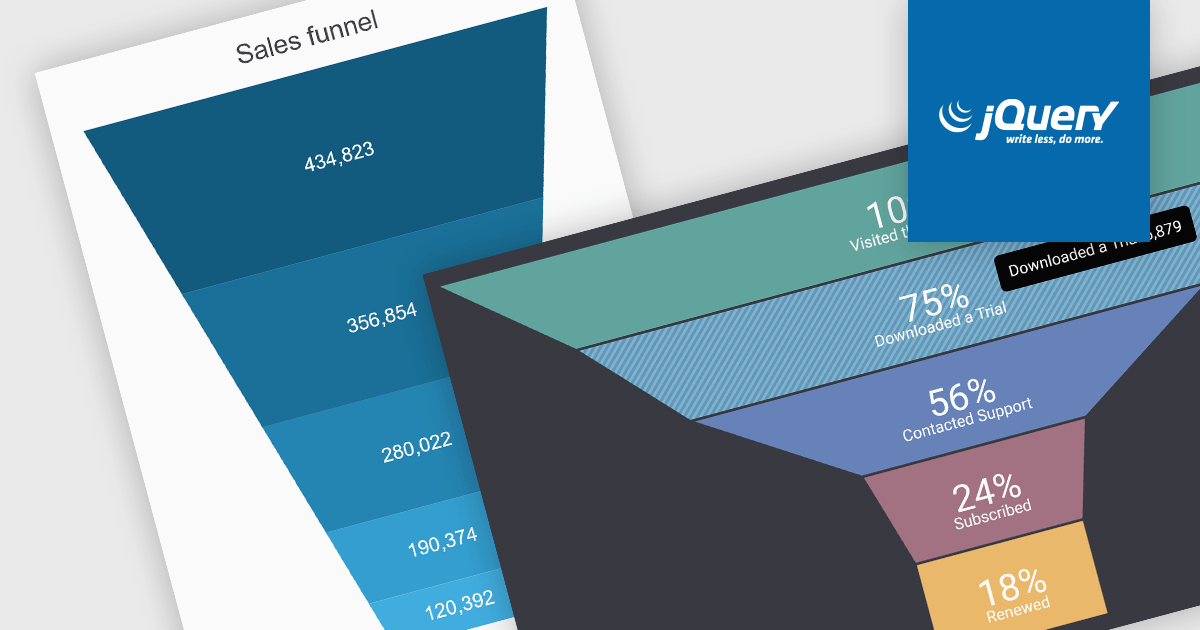
A funnel chart is a type of visualization that graphically depicts the stages of a process and the progressive flow of values through those stages. It gets its name from its shape, typically resembling a funnel with a wide top and narrow base. Funnel charts are particularly useful in sales and marketing contexts for tracking potential customers as they move through the sales pipeline, identifying bottlenecks, and pinpointing areas where performance might be improved.
Several jQuery chart controls offer Funnel charts including:
For an in-depth analysis of features and price, visit our jQuery chart controls comparison.
전화 : 00798 14 800 6332
팩스 : +1 770 250 6199


