


공식 공급 업체
200 이상의 소프트웨어 개발처와 판매 계약을 맺은 공인 디스트리뷰터로서 합법적인 라이선스를 제공합니다.
모든 브랜드 보기.
영어로 계속 읽기:
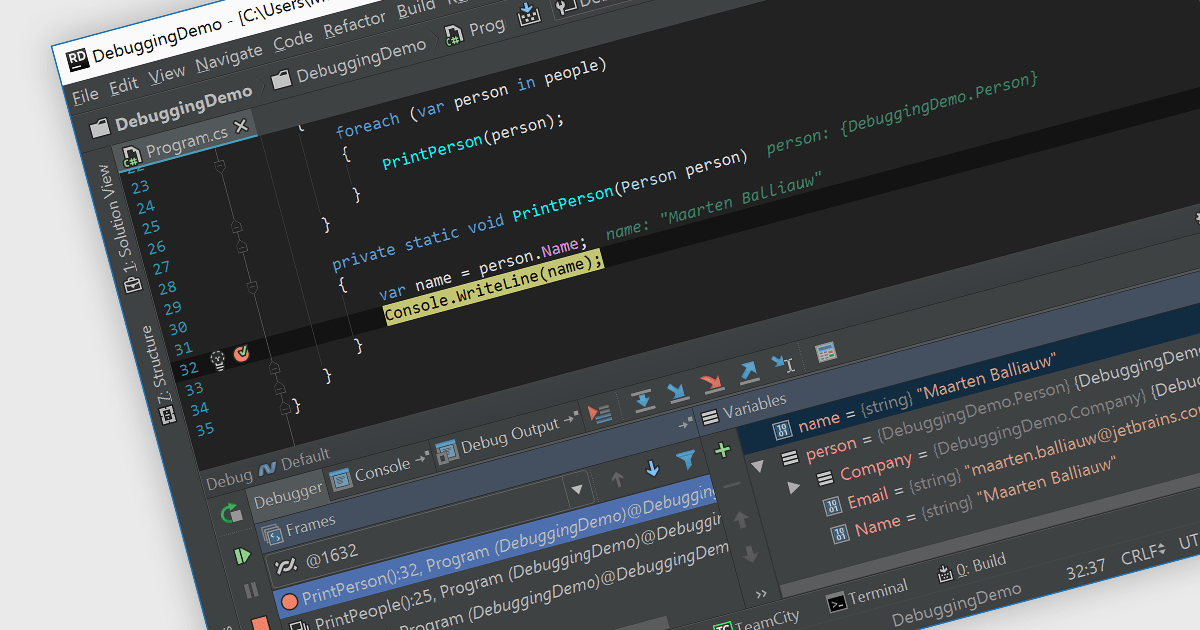
Debugging is the methodical process of identifying and rectifying errors or bugs within code. Many Integrated Development Environments (IDEs) provide a platform for debugging by allowing programmers to step through code execution line by line, examine variable values at specific points, and set breakpoints to pause execution at designated sections. This controlled environment empowers developers to easily pinpoint the cause of issues and implement fixes.
Several IDEs provide debugging including:
For an in-depth analysis of features and price, visit our IDEs comparison.
전화 : 00798 14 800 6332
팩스 : +1 770 250 6199


