


공식 공급 업체
200 이상의 소프트웨어 개발처와 판매 계약을 맺은 공인 디스트리뷰터로서 합법적인 라이선스를 제공합니다.
모든 브랜드 보기.
영어로 계속 읽기:
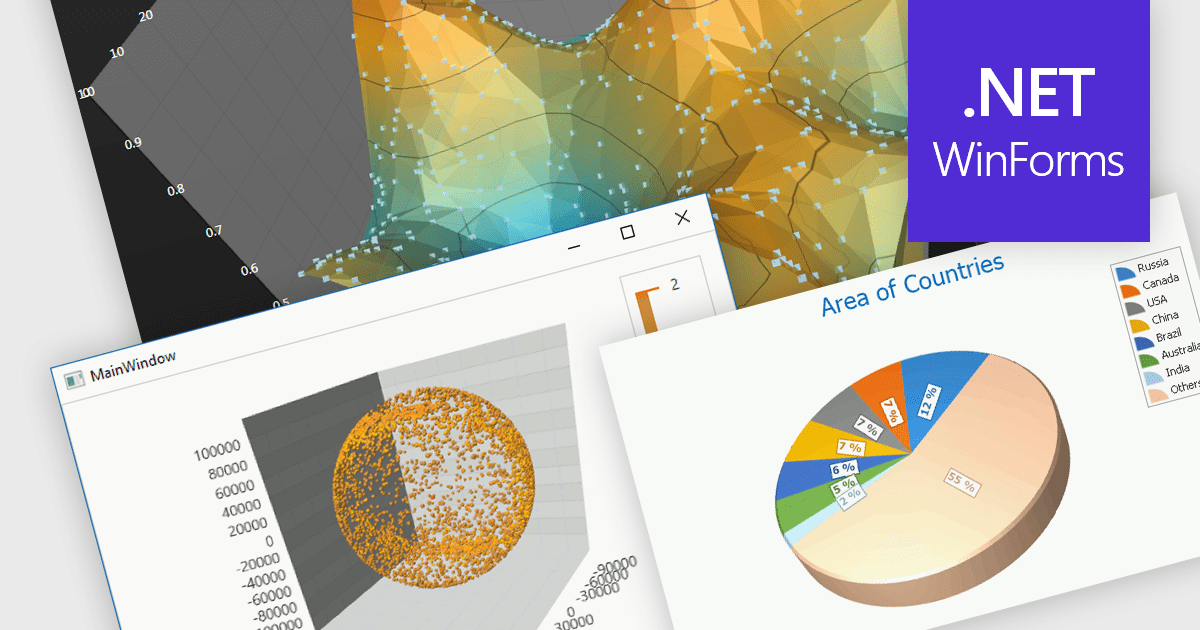
3D charts excel at showcasing complex datasets with three variables. By adding depth, they allow viewers to grasp intricate relationships between these variables that might be difficult to decipher in a flat, 2D format. This enhanced visualization can reveal patterns and trends that would otherwise remain hidden, leading to a deeper understanding of the data.
Several WinForms Chart controls offer 3D charts including:
For an in-depth analysis of features and price, visit our WinForms Chart controls comparison.
전화 : 00798 14 800 6332
팩스 : +1 770 250 6199


