


공식 공급 업체
200 이상의 소프트웨어 개발처와 판매 계약을 맺은 공인 디스트리뷰터로서 합법적인 라이선스를 제공합니다.
모든 브랜드 보기.
영어로 계속 읽기:
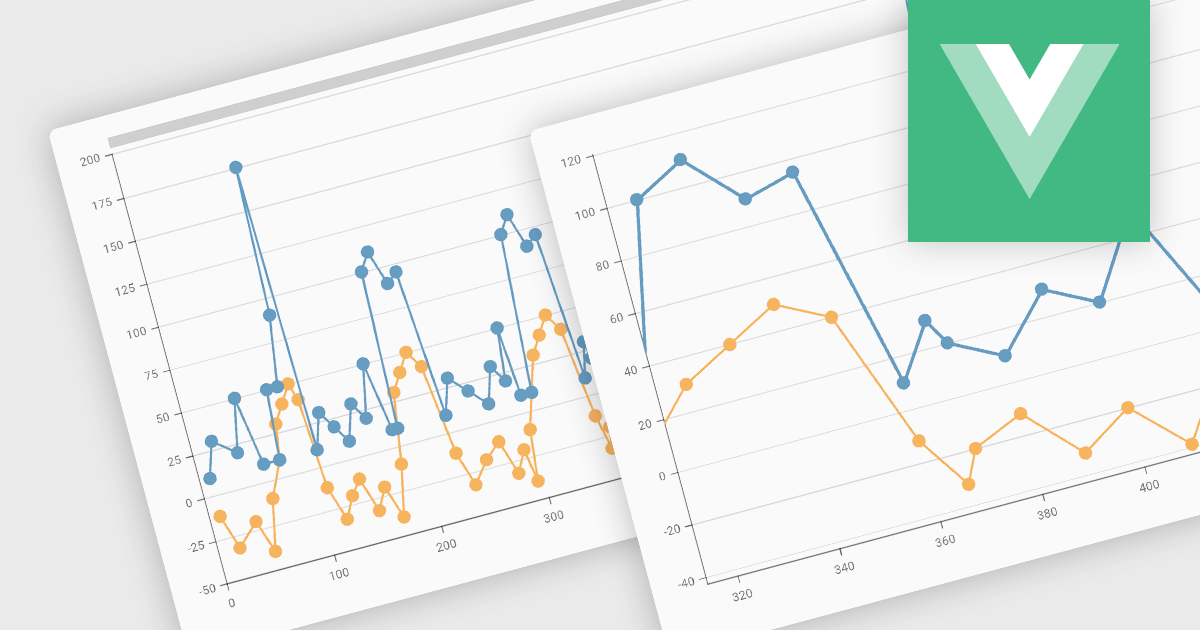
Zooming functionality in a chart component empowers users to delve deeper into complex datasets. By allowing for magnified views of specific areas, users can identify trends, outliers, and patterns that might be obscured in a broader, more generalized view. This interactivity fosters a richer understanding of the data and facilitates more informed decision-making for end users.
Several Vue.js chart controls support zooming including:
For an in-depth analysis of features and price, visit our comparison of Vue.js Charts.
전화 : 00798 14 800 6332
팩스 : +1 770 250 6199


