


공식 공급 업체
200 이상의 소프트웨어 개발처와 판매 계약을 맺은 공인 디스트리뷰터로서 합법적인 라이선스를 제공합니다.
모든 브랜드 보기.
영어로 계속 읽기:
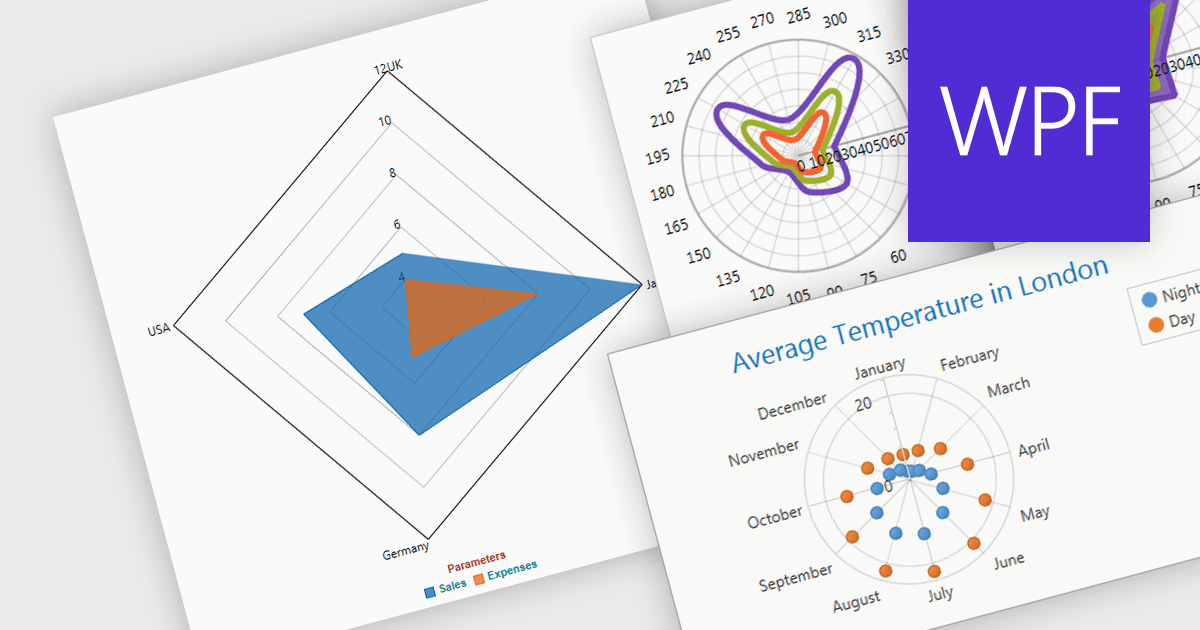
Radar and polar charts are both visualizations for displaying multiple data Radar charts specifically connect the data points to form a web-like shape, highlighting relative strengths and weaknesses across categories. Polar charts focus on the angular relationship between data points. Both are ideal for comparing sets of data with several variables, making them valuable tools in fields like performance analysis, where strengths and weaknesses across different metrics need to be understood.
Several WPF chart components support radar and polar charts, including:
For an in-depth analysis of features and price, visit our comparison of WPF chart components.
전화 : 00798 14 800 6332
팩스 : +1 770 250 6199


